
13Feb10:38 amEST
More Vision to the Situation

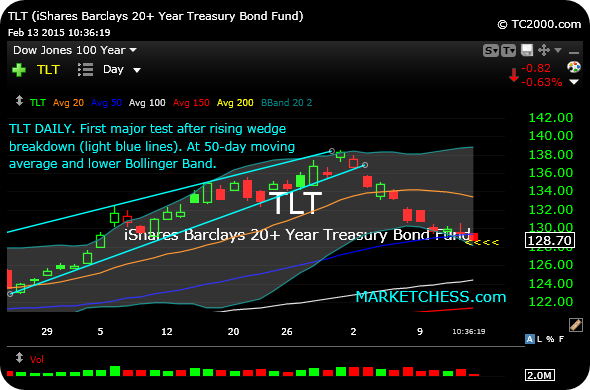
I posted the following chart of Treasuries on Stocktwits last night, the daily timeframe for the TLT ETF. The chart seemed to garner much interest, as the bond market appears to be at some critical juncture.
The main issue on this rising wedge breakdown is whether it would be another routine pullback in an otherwise ferocious bull market, lasting for decades now but particularly strong since 2014, or instead would mark some type of inflection point.
Based on the action this morning, Treasuries are losing that 50-day moving average, though the close will be critical by day's end.
As such, rate-senstiive sectors such as the IYR, REITs, are on my short radar again via long SRS or long DRV positions.
Stock Market Recap 02/12/15 ... The Last Good Stand: Preciou...


