24Feb1:30 pmEST
The Extinct Shooting Star

In light of the nature of this particular bull market and all of its accompanied false breakdown and "sucker tops," it almost seems like a sacrilegious act to even mention the classic topping signs.
But I am going to do it anyway, not as some form of stubbornness but rather to avoid the pitfalls of late-stage bull markets which inevitably focuses on pushing traders off their risk awareness and towards an all-in-just-can't-lose bias.
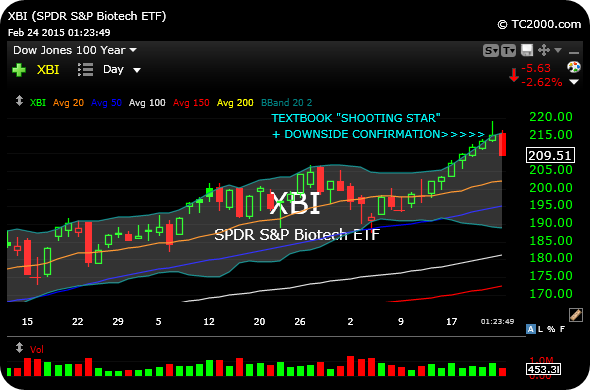
With respect to the XBI ETF daily chart candlestick I discussed yesterday in my video market recap, we are seeing actual confirmation of that bearish "shooting star" reversal today. The XBI is another biotechnology sector ETF, in addition to IBB. After a steep uptrend, the shooting star means price had a new high, but sellers subsequently pushed price down to close near the lows of a wide-ranging session. It often means a reversal is nigh.
Select small, mid-cap, even large cap biotechs are green today. But some big names like BIIB are finally seeing some selling. I mentioned BIIB as being in a rising wedge last night on its daily chart. And that is still worth watching.
The easiest counter to this analysis is the nature of this bull market, where a gap higher tomorrow or later this week would not surprise even the most ardent of bears. But whether that continues to happen or if this is the real deal, a real trader can look at this chart and know his or her risk parameter is now better-defined, with an "easy" cover-stop on a short trade over today's highs on XBI for a tight stop, or a stop over yesterday's highs for a more standard one.