03Mar11:34 amEST
Active Trader's Guide to Apple
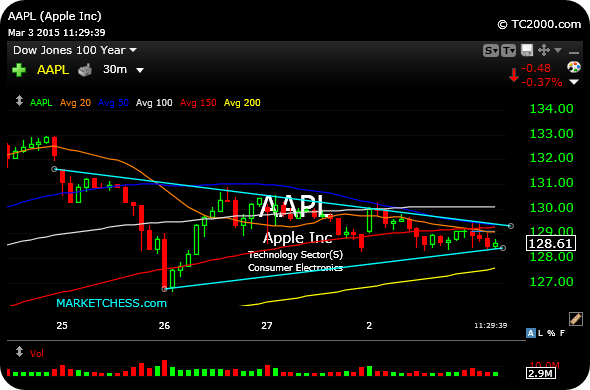
We looked at the $130.30 level on AAPL as being an important short-term point of reference for active and day-traders in this large, liquid, premier stock.
Updating that analysis, note that chart patterns can and often do morph into larger ones.
And on the 30-minute chart for the heavily-weighted Nasdaq issue, we can see the highlighted triangle pattern being formed after bulls failed to regain $130.30 for any meaningful period of time.
If sellers can push down through $128.30 I suspect we will see buyers start to hit the exits on this timeframe.
Of course, it is important to know you timeframe. Long-term investors in AAPL or even intermediate-term swings who have been in the name from much lower prices have a much different perspective, as it should be.
But for fresh money short-term trades, those are the levels I am watching on AAPL.