23Mar12:17 pmEST
Potential for a Trap

After rallying over the past several trading sessions, energy stocks are now up against some interesting technical points of reference.
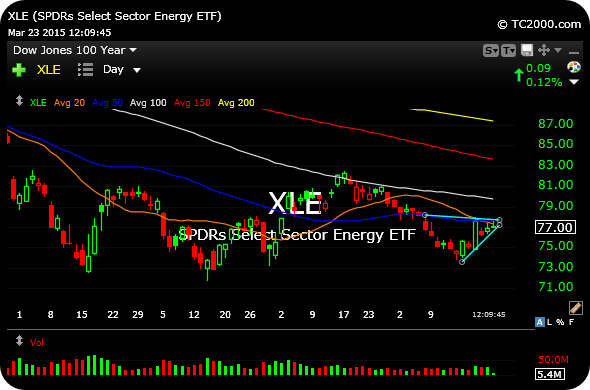
On the energy sector ETF daily chart, below, note the 20 and 50-day moving averages now greeting price after the bounce off recent lows.
In addition, note the light blue lines I have drawn denoting a possible bear wedge within the context of an ongoing downtrend (look no further than those declining long-term daily chart moving averages, well above price, to support that assertion.
Some top individual names to observe are: CVX SLB XOM. CVX is already red on the day and SLB XOM are fading opening strength.
My ongoing thesis is that crude and energy stocks are mired in a sloppy sideways range. However, the trend remains down and so, too, does the risk of a rollover. While it may seem easy to mock the idea of another leg down in the crude and energy stocks, buyers seem to lack a sense of urgency and conviction typically associated with durable bottoms.
ERY is a bearish ETF I would consider again if the XLE is rejected from the points of reference, below.