
10Apr2:27 pmEST
A Wicked Long-Term Look at General Electric

After dismantling GE Capital, GE's stock is shooting up nearly 9% today.
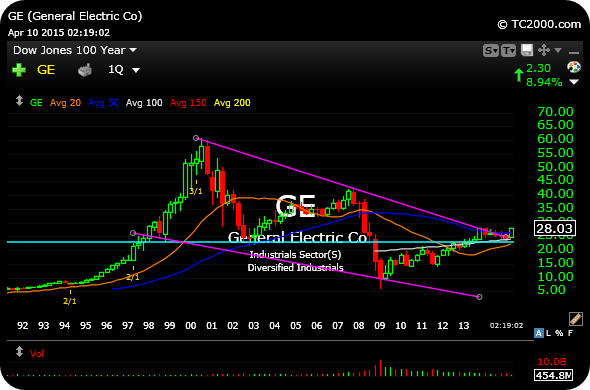
On the quarterly chart, below, we can see that the mega cap had endured two steep crashes in a span of eight years, finally bottoming out in early-2009 and taking the stairs higher ever since.
The $23 level (light blue horizontal line, very key dating back many years) was initially difficult for the stock for a while there.
But not comes the next hurdle--Cementing a close and hold over $28. Also note the purple lines I have drawn could easily denote a multi-decade falling channel pattern.
All in all, I am not drawing too much from this GE strength other than the market looking for a reason to cheer a move which probably should have been done years ago, anyway. GE is a stodgy mega cap and not likely to be too much of a market "tell" at this point.
Say Hello to Those Hacks for... Looking for Another Good Fit...


