04Nov10:44 amEST
A Simple Observation

Despite a GPRO earnings blow-up and crude oil swooning again, stocks are finally reacting a bit to oversold conditions this morning.
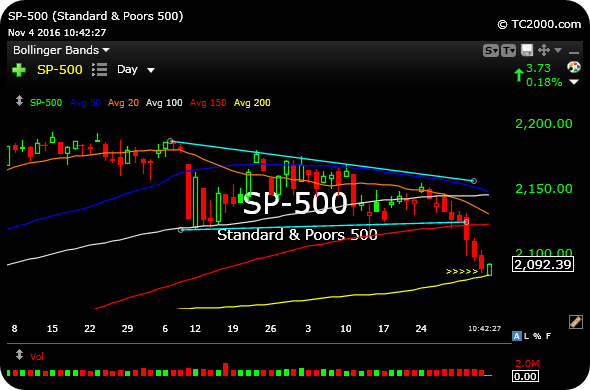
Specifically, the S&P 500 Index, on the daily chart, below, is showing some life off its 200-day simple moving average (yellow line). The 200-day is a widely-watched reference point, even by non-technicians who outwardly may eschew technical analysis. In reality, when the market gets dicey plenty of non-technicians will suddenly consult the charts--You can be sure the 200-day will make its way into their analysis.
At issue for we traders is whether this bounce is something beyond an initial reaction to both the 200-day and oversold conditions. A mere 200-day bounce is insufficient evidence of a meaningful market bottom, for example. Biotechnology stocks likely hold some key to this answer, as the IBB and XBI ETFs are bouncing here, too. A modest snapback rally into Tuesday's General Election makes sense. But then again this market can often defy logic.
There are a few select sectors and inter-market plays we are stalking for Members this morning. But, overall, remaining light in net exposure through the election still likely makes sense.