09Nov1:27 pmEST
Still the Most Important Long-Term Chart

Although there are plenty of headlines covering up the price action in the bond market, it should not be lost on us that Treasuries are acting more and more as though they have arrived at a meaningful inflection point.
Not only has TLT failed to sustain a bounce from recent oversold conditions, but the accompanying rate-sensitive sectors in equities (REITs, utilities, and banks on the other side of that coin) continue to act as though rates are going much higher.
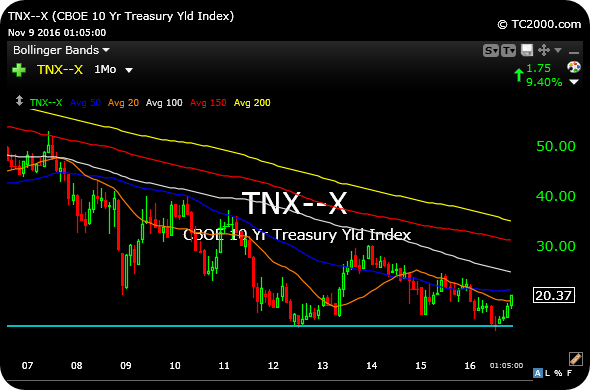
To update our ongoing and longstanding series of posts on this topic, we need to remain methodical since a multi-decade (!) bottom in rates will not be confirmed until rates on the 10-year spike at least back over 3%. As you can see on the TNX, the Yield Index for the 10-year, below on the multi-year look, we have a good deal of ground to cover to the upside before that occurs.
But if you were to highlight some of the key elements of a major bottom in rates, and thus top in the bond market, you would look for rates to come off the second low of that double-bottom (light blue line) ferociously, which they are now, alongside the rate-sensitive sectors in equities confirming the action.
Simply put, The Fed likely does not want rates spiking higher. At issue now is how far behind the cure The Fed truly is here, and whether they simply must play catch-up by raising rates in December.
I will bring this thesis into focus with specific, actionable trade ideas for Members in my usual Midday Video now.