19Jan3:39 pmEST
Big Evening Blue Before the Big Day Tomorrow

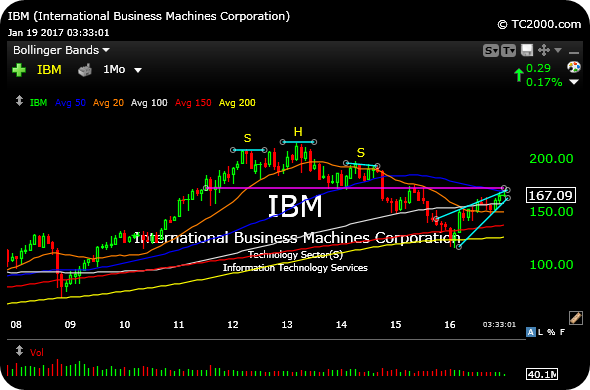
Long-time readers will recall, back in 2010, looking at IBM (or "Big Blue") in a bullish light, ready to break out of a multi-year base higher. At a certain point, though, namely in 2013, Big Blue began to slow down and display the hallmarks of a textbook long-term head and shoulders top. This top coinciding with plenty of self-described value investors merely piggy-backing Warren Buffett into the name, around the same time as the stock printed $200 per share, or so.
Since then, IBM viciously confirmed the major top, hitting the measured move of the pattern lower (the measured move, roughly, is assessed by subtracting the price of the top of the "head" from the "neckline," then subtracting that number from the neckline).
After the measured move was achieved, we noted that it was essentially anyone's game now, meaning the edge for the bear case had diminished, but bulls had yet to really show in with force, either.
Headed into earnings tonight, Big Blue has retraced, on its monthly chart, up to the level from which it broke down previously, or its neckline (purple).
Although it is fair to say that IBM is no longer the tried and true Nifty Fifty market leader it was decades ago, it is still worthwhile to monitor the name, being a mega cap tech play and all. If the bear case is to persist here, then we ought to see swift rejection at the prior neckline, with earnings tonight potentially ushering in the next move.