
18Apr10:49 amEST
Clear the Tracks

It has been a particularly frustrating five months or so for those expecting an imminent directional move in Treasuries.
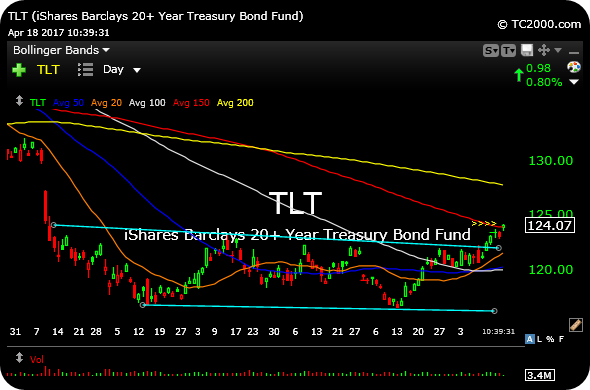
TLT, below on the daily timeframe, is a rough proxy as an ETF. But it does indeed illustrate the point that bonds have been flopping around like a fish out of water since November 2016.
But with TLT breaching $122 in recent sessions, a level we have been closely tracking for Members, bonds may get a reprieve into the summer months.
Indeed, a more defined, clear path now exists for a simple test of the 200-day moving average (yellow line) could easily materialize within the context of an ongoing downtrend since, after all, that 200-day is still clearly declining.
Bonds are likely benefitted from a "risk off" trade, as equities flounder this morning on the back of NFLX BAC GS CUDA JNJ HOG VRX all notably red after some earnings and assorted news flow.
Regarding TLT, the $124 area here coincides with the 150-day moving average (red line) and is likely the best battleground area before we can expect the 200-day to come back into play. But, for now, bonds, the Yen, and gold bullion (even if the miners are underwhelming) are chic again as being the safe haven plays.
Stock Market Recap 04/17/17 ... They Focus on Red Lines; We ...


