
01Jun1:46 pmEST
Small Caps Up and In

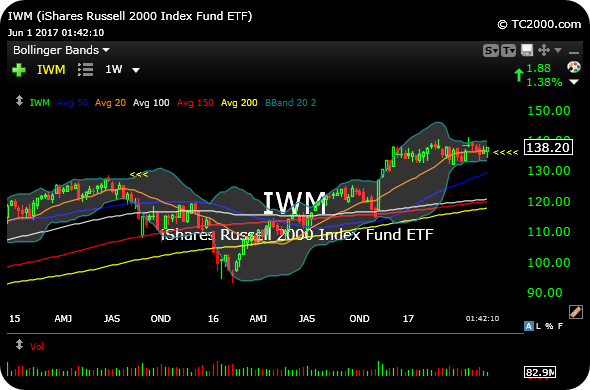
One of our Members, @Scungelli, astutely pointed out earlier this week that the weekly chart for the Russell 2000 Index's ETF (IWM) was likely sporting the tightest Bollinger Band compression we had seen since 2015.
Generally speaking, from periods of compression in the market come periods of expansion or explosion. Back in the summer 2015, the first set of yellow arrows on the IWM weekly chart, below, shows the expansion was lower for a sharp summer correction, which actually lasted into early-2016 for the lagging small caps.
This time around, with the same compressed setup, bears were/are betting on that same result.
However, with yesterday's upside reversal to nearly finish green compounded by today's impressive rally into the afternoon, it raises the specter of the expansion favoring bulls.
As we know, the end of result of the small cap compression ought to coincide with the broad market's next move, too, which adds to the tension of the moment.
At the moment, bulls are making their stand off yesterday's $134 support test, and now threaten a runaway move higher if they can convert $138 back into support.
Emerging Trends in Technolog... The Market is Predicting Gol...


