25Jul1:36 pmEST
Many Mickles Make a Muckle

One of the main reasons we like to regularly look at longer-term timeframes, even as traders, is to gain better perspective of a stock's big picture in terms of price action.
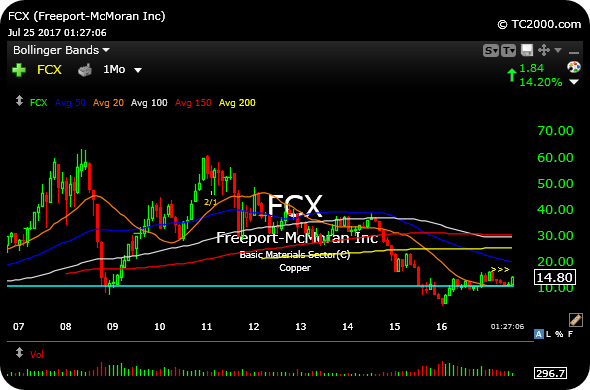
Regarding the prominent copper miner, Freeport-McMoran, on the back of a sharp earnings rally today, we can see the monthly FCX chart, below, indicate that today's rally pales in comparison to the unforgiving corrective trend of mostly lower highs and lower lows since 2011.
To be sure, the weak action in FCX for years on end was a notch in the belt for the deflationist types, as Treasuries rallied and bounced back from a taper tantrum or two.
But with today's rally, it is also worth noting the sum of all of those recent monthly chart candlesticks. Recall that on a monthly chart, each candlestick, red or green, represents the price action for one month of trading.
And when we do just that, we can see the sum of the parts as FCX successfully regained and then held onto the prior 2008 crash lows. While this may seem like a relative modest feat, in reality it helps to stave off the imminent deflation case for a new leg down in industrial commodities like copper.
Moreover, FCX helps itself in making a case for a major bottom as it successfully responded to those 2009 crash lows.
That was a major, not minor, price area and copper bulls are answering the bell today. Similar comments apply to the likes of steels and global miners such as BHP.
More on the market in my usual Midday Video for Members.