
06Sep10:46 amEST
Tar Jay Tarred and Feathered

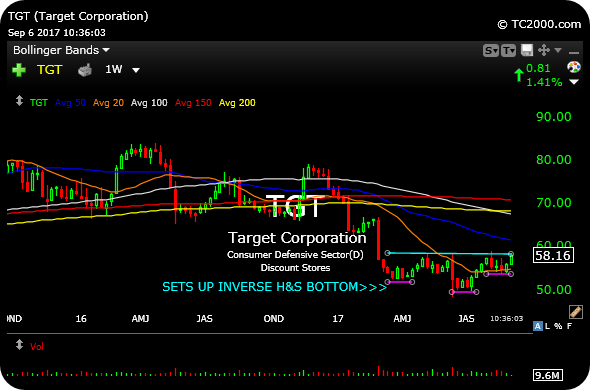
It has been a rough nine months or so for Target, trading nearly $80 per share around Thanksgiving 2016 before sliding to a low of $48.56 this summer. To be sure, the Amazon-Eats-All theme has not been helpful to TGT's brand image, let alone its share price.
But the general "coolness" the brand enjoyed a few years ago also seems to be dissipating amid the usual innovations in capitalism alongside the retail experience.
Still, Target offers value to money-conscious consumers, and it almost assuredly is seeing a nice surge in storm prep for Florida, let alone recent surges in Louisiana and, of course, Texas.
Putting hurricane season to on side, however, the weekly chart for TGT, below, shows something beyond an event-driven pop which could easily fade.
Instead, Target is knocking out a right shoulder of a major potential inverse head and shoulders bullish formation. After prior, established downtrend, which TGT has clearly been in since last November, the outlined inverse head and shoulders formation can indicate a looming upside reversal. Another push over $59 projects a move roughly up to $68, at least.
It is also worth noting that TGT trades with a much smaller market cap than the likes of WMT CVS, even COST, which means a buyout is not out of the question.
Either way, it is interesting to see TGT sporting a well-defined potential bottoming pattern amid every reason possible to expect the brand (and stock) to eventually fade away amid a bevy of headwinds.
Stock Market Recap 09/05/17 ... Buy Me a Boat: Hurricane Edi...


