
14Mar10:58 amEST
Two Charts Which Make Sense Amid the Quagmire

Even with the semiconductors soundly red this morning we have seen buyers generally out and about, not sweating the stagflationary PPI and retail sales prints this morning too much.
Microsoft is higher by more than 2.5% which, at its $3.1 trillion market cap size, will keep the overall index selling tame unless it reverses.
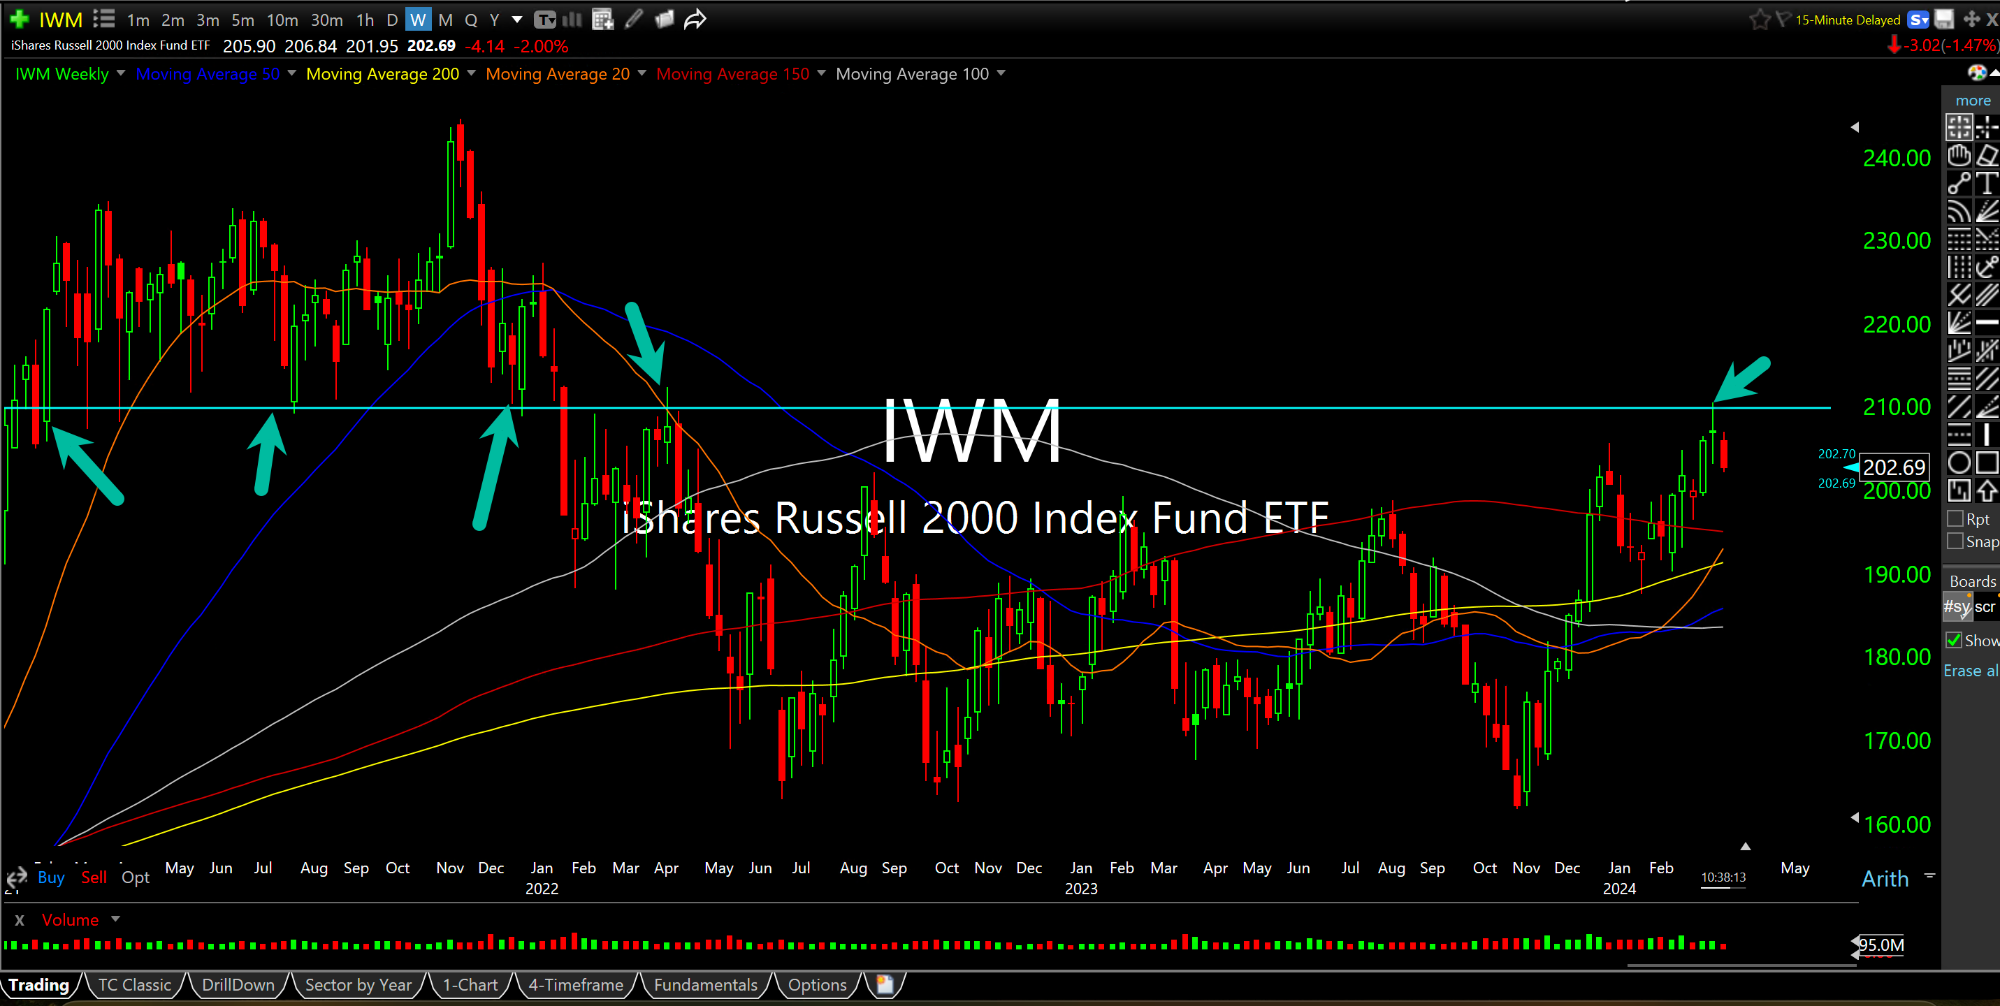
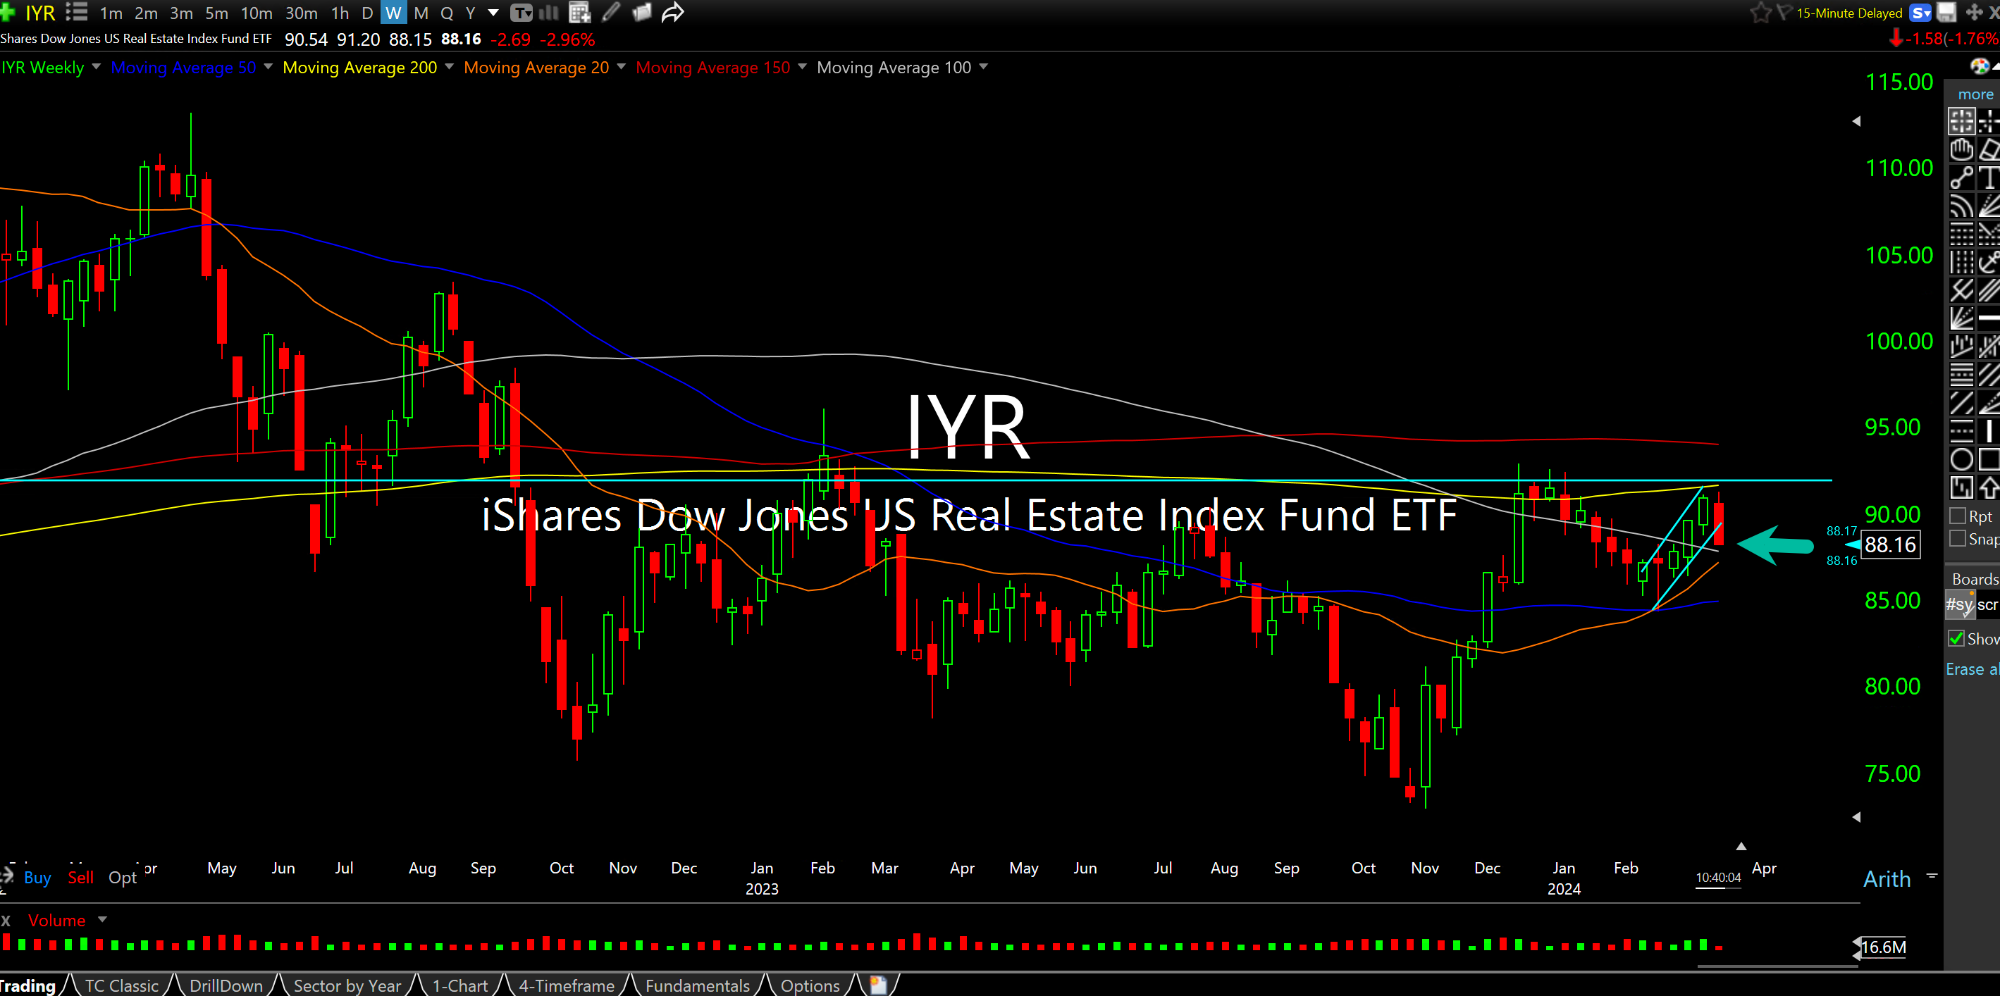
However, the small caps on the IWM ETF (weekly chart, first below) are being turned away at meaningful prior resistance as you can see. In addition, the REITs in the IYR ETF (second weekly chart, below) are seeing the expected reaction by commercial real estate stocks to higher rates today.
Thus, in a market full of contradictions marked by euphoria and complacency we have at least some semblance of logic in the smalls and REITs. But once again, until we see those mega caps beyond TSLA get liquidated it is going to be more quagmire-like action.
That said, I do believe rates on the 10-Year Note clearing 4.3%, an area of resistance in February, would be a game changer going forward and negatively impact even the monsters in the Magnificent 7.
Money Where Mouth Is: I Went... Take Everything You Know Abo...


