13Mar12:06 pmEST
Finally Feels Like the 1970s Again
The last time we saw a prolonged period of entrenched inflation in this country was during the 1970s.
During that period, gold and oil stocks were the two top performers, all the while the "Nifty Fifty" high-flying growth stocks of that era finally saw their collective bubble pop. Indeed, the "stagflation" period of slowing growth and sticky high inflation eventually pricked the bubble in chic, crowded, growth stocks (sound familiar?) and saw that money make its way over the real assets like gold and oil.
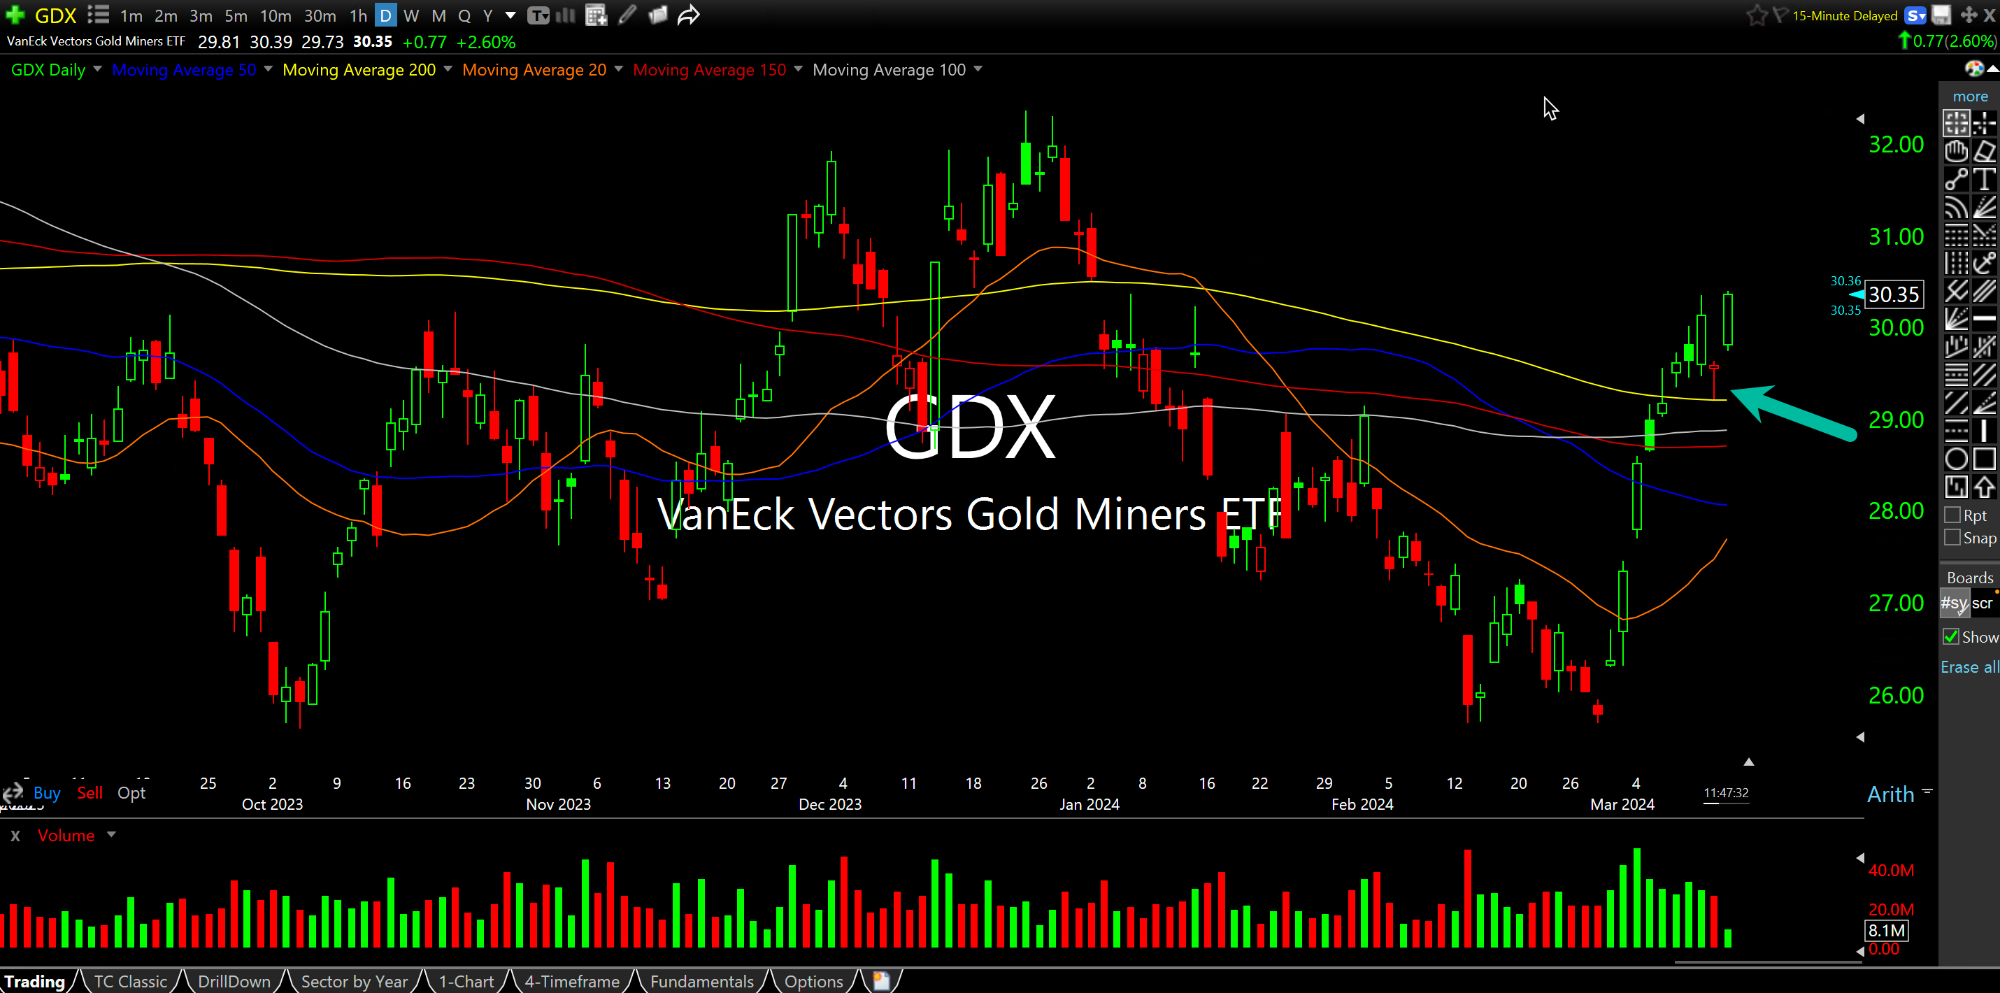
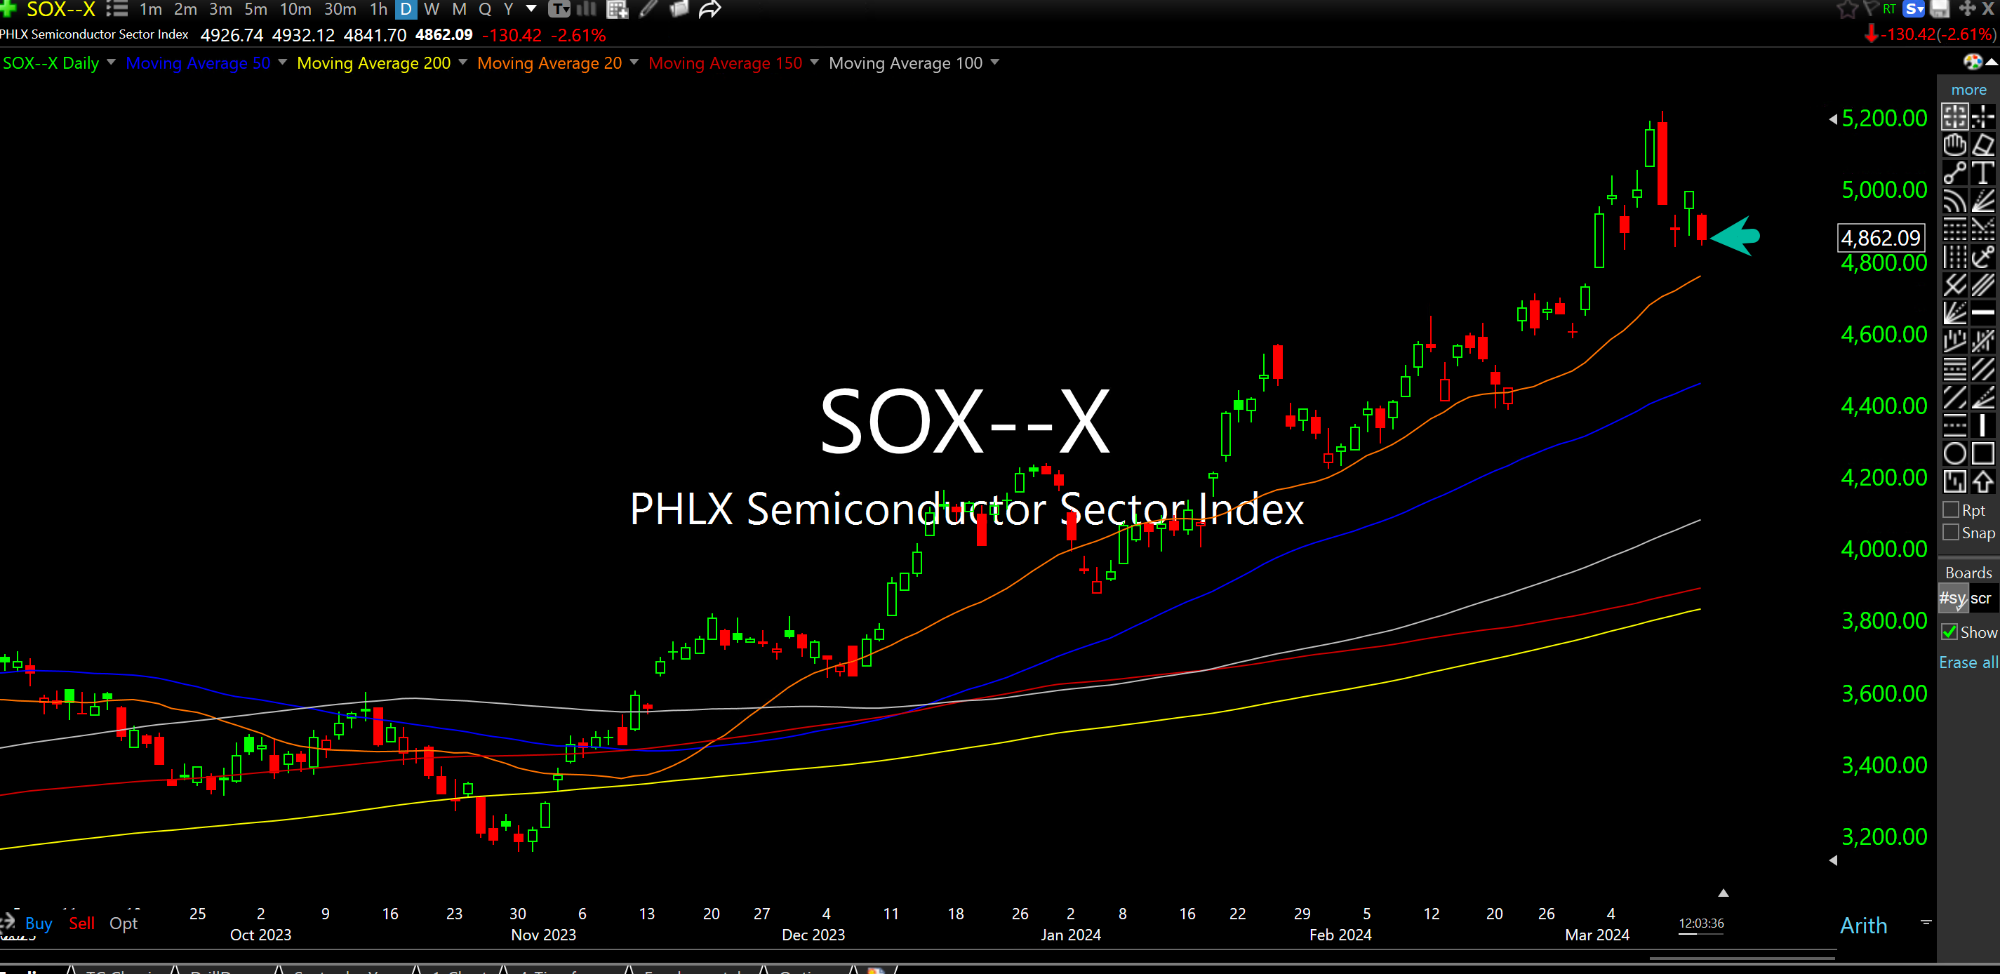
While history tends to rhyme more than repeat, we are at least seeing shades of the 1970s today. We have the semiconductors giving back most or all of yesterday's gains as a group, as seen on the daily chart for the SOX (Philadelphia Semiconductor Index, second below). Meanwhile, gold miners (first daily chart, below) and oil stocks are notable outperformers.
Headed into the PPI tomorrow morning, then the FOMC next week (as well as the Bank of Japan meeting), the true test will be if this rotation keeps up.
As bullish as I am on gold and oil over the next decade or so, I still am allowing for a scenario where the obvious crowded trade in volatility selling causes a market-wide liquidation event which takes all the babies out with the bathwater before we see a true sustained uptrend from oil and gold stocks.
But the only way that happens is if we first see chips and the "Magnificent 7" bubble truly pop en masse, beyond TSLA and AAPL weakness.