07Jan11:19 amEST
Stairway Down
 I present the 30-minute chart for the small cap ETF, IWM, illustrating the lower highs and lower highs for the Russell 2000 Index stocks dating back to New Year's Eve.
The current bounce since yesterday looks to be a mere bear flag, but shorts need to keep an open mind that it may fail to resolve lower, much like the RSX (Russia ETF) failed to do so and is gapping up today.
Nonetheless, this chart helps keep the current bounce in perspective.
Bulls want to clear at least $116.50 to the upside to make real progress, while a move back under $115 likely sets another breakdown in motion.
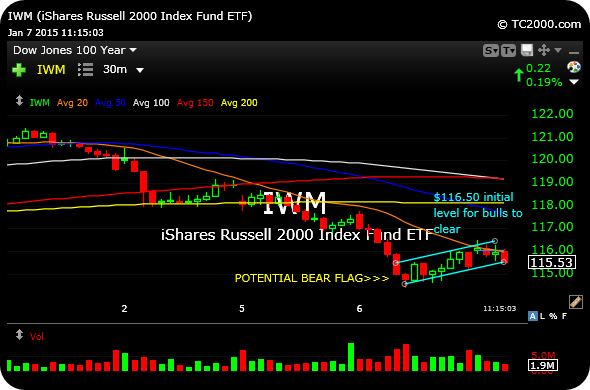
I present the 30-minute chart for the small cap ETF, IWM, illustrating the lower highs and lower highs for the Russell 2000 Index stocks dating back to New Year's Eve.
The current bounce since yesterday looks to be a mere bear flag, but shorts need to keep an open mind that it may fail to resolve lower, much like the RSX (Russia ETF) failed to do so and is gapping up today.
Nonetheless, this chart helps keep the current bounce in perspective.
Bulls want to clear at least $116.50 to the upside to make real progress, while a move back under $115 likely sets another breakdown in motion.