08Jan2:48 pmEST
Russia: You Think You Can Break Me?
 The strength in equities as a whole is palpable this afternoon, with the indices pushing fresh session highs as I write this. I am not inclined to chase longs, nor put on index shorts, just yet. I suspect sometime tomorrow or perhaps a Monday morning gap higher will see a better short entry if this truly is a mere reflex rally within an ongoing correction.
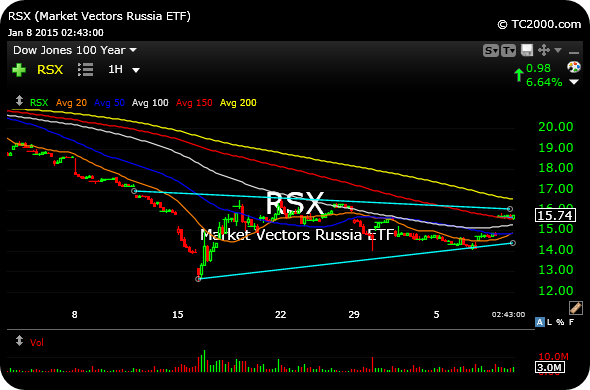
In the meantime, the Russia ETF chart reminds us of an important concept in technical analysis--Chart pattern can and do morph.
That may be to the chagrin for the many new traders in this bull market who think that always having "the" answer as to whether a chart is bullish or bearish is correct. But, over time, that way of thinking breaks far more traders in this business than it makes them.
As we can see, the zoomed-out hourly chart for the RSX, stretching back nearly a month now, suggests bears failed to break Russia lower after the prior decline. What seemed to be a bear flag at first could now easily be a bottoming base formation.
If RSX can clear $16.30 upside it is hard not to see a vicious short squeeze higher. RUSL is the tripe-long Russia ETF. Russia bears, in all likelihood, need a move back under $14.60 to regain the initiative.

Rock Salt Jayhawk for a Defe... Closing Out A Few Winners In...


