
08Jan12:54 pmEST
Here is the Throwback
 Exuberant bounces within ongoing corrections are the rule, not the exception. And, typically, they set up the next leg down. However, we know this bull market, especially since 2013, has featured the new "rule" being V-shape rallies to fresh highs, throwing a wrench in the historical mode of analysis.
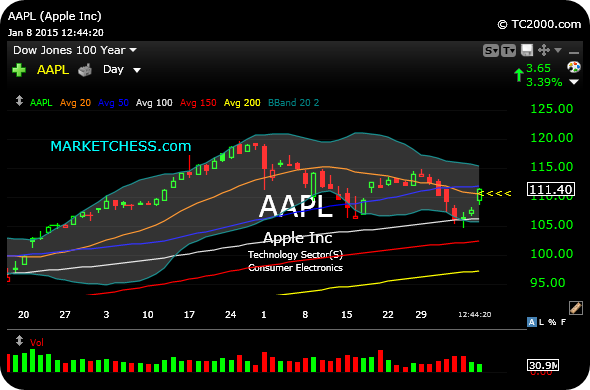
Nonetheless, the Apple daily chart, first below, being the huge weighting in the Nasdaq that it is, compels us to consider what happens if this bounce runs out of steam.
Note the 20 and 50-day moving average confluence here (orange and dark blue lines), as price bounce off the lower Bollinger Band. A reflex rally, or relief bounce, back up the "middle Band," or 20-day moving average, is simply mechanical (known as a "throwback") and is typically not indicative of a resumption of the overall uptrend. Put another way, risk of rollover is still present, especially if buyers run out of steam this afternoon and we see a fade into the close. Unless and until AAPL regains $115, I am in the camp that this remains and ongoing correction.
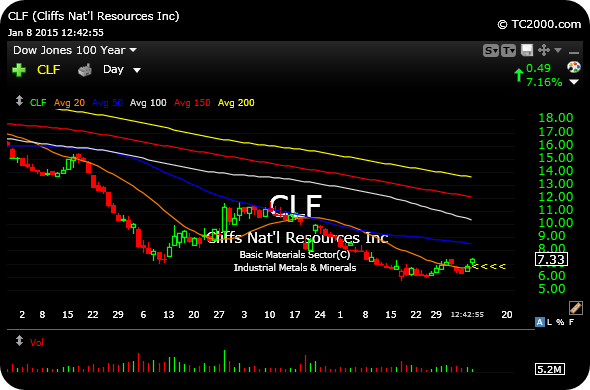
Elsewhere, select materials miners are catching a bid, namely CLF. Let's see if it can close and hold over its own 20-day moving average, seen on the second daily chart, below, to indicate a short-term change in character for the better from badly beaten-down conditions.
Exuberant bounces within ongoing corrections are the rule, not the exception. And, typically, they set up the next leg down. However, we know this bull market, especially since 2013, has featured the new "rule" being V-shape rallies to fresh highs, throwing a wrench in the historical mode of analysis.
Nonetheless, the Apple daily chart, first below, being the huge weighting in the Nasdaq that it is, compels us to consider what happens if this bounce runs out of steam.
Note the 20 and 50-day moving average confluence here (orange and dark blue lines), as price bounce off the lower Bollinger Band. A reflex rally, or relief bounce, back up the "middle Band," or 20-day moving average, is simply mechanical (known as a "throwback") and is typically not indicative of a resumption of the overall uptrend. Put another way, risk of rollover is still present, especially if buyers run out of steam this afternoon and we see a fade into the close. Unless and until AAPL regains $115, I am in the camp that this remains and ongoing correction.
Elsewhere, select materials miners are catching a bid, namely CLF. Let's see if it can close and hold over its own 20-day moving average, seen on the second daily chart, below, to indicate a short-term change in character for the better from badly beaten-down conditions.
The Best Nation in the World... Stock Market Recap 01/12/15 ...


