
25Jan11:06 amEST
Stuck in a Krispy Kreme Sandwich
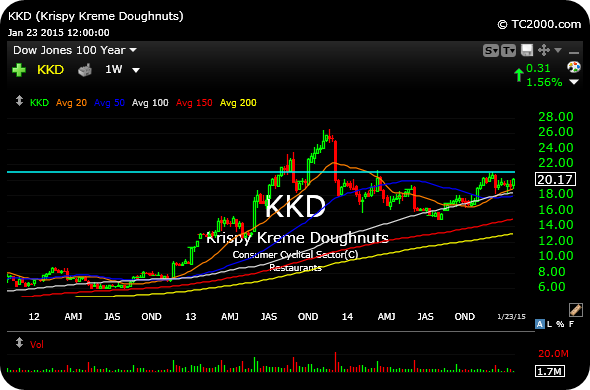
 The weekly chart for Krispy Kreme may very well sum up the current state of the market
You can see the prior, strong if not steep multi-year bull run, followed by a pullback and recent consolidation. Bulls will argue the chart looks ripe to spring much higher from a coiled base, while bears contend the stock has already topped out and is simply biding time until the next leg down.
Moving and holding over the big $21 level above is important to observe for the stock, on a standalone basis, to negate that bearish thesis. But as far as the analogy to the broad market, stay tuned for my Weekend Video Strategy Session, later today.
The weekly chart for Krispy Kreme may very well sum up the current state of the market
You can see the prior, strong if not steep multi-year bull run, followed by a pullback and recent consolidation. Bulls will argue the chart looks ripe to spring much higher from a coiled base, while bears contend the stock has already topped out and is simply biding time until the next leg down.
Moving and holding over the big $21 level above is important to observe for the stock, on a standalone basis, to negate that bearish thesis. But as far as the analogy to the broad market, stay tuned for my Weekend Video Strategy Session, later today.
Saturday Night at Market Che... Weekend Video Strategy Sessi...


