
30Jan11:43 amEST
Just Short It; Chess Moves
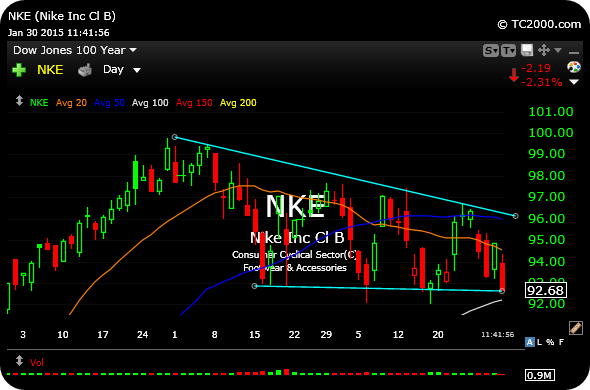
 I went short NKE here at $92.93 with a cover-stop over $97. The position is roughly 4% of my trading capital.
I am playing for a daily chart breakdown from the well-defined descending triangle (light blue lines), seen below. I am also playing for the stock's long-term, abnormally steep trend to break.
Simply put, Nike has enjoyed an incredible run since the 2009 bear market bottom especially for such as a mature, large cap company. However, any signs buyer fatigue up here warrant a shot on the short side to play for a prospective sharp correction.
I went short NKE here at $92.93 with a cover-stop over $97. The position is roughly 4% of my trading capital.
I am playing for a daily chart breakdown from the well-defined descending triangle (light blue lines), seen below. I am also playing for the stock's long-term, abnormally steep trend to break.
Simply put, Nike has enjoyed an incredible run since the 2009 bear market bottom especially for such as a mature, large cap company. However, any signs buyer fatigue up here warrant a shot on the short side to play for a prospective sharp correction.
Cold Weakness When There Sho... Join Us for a Limbo Luau Par...


