06Feb12:40 pmEST
Going for a Scalp with the Oil Cowboys; Chess Moves
 In what may turn out to be merely a day-trade, I went long UWTI (triple-log crude oil ETF) at $3.69 with a protective stop-loss below $3.55.
My theory is still that crude is a trading vehicle until further notice, in lieu of calling a big bottom or playing for another crash.
As such, quick trades can be found here and there.
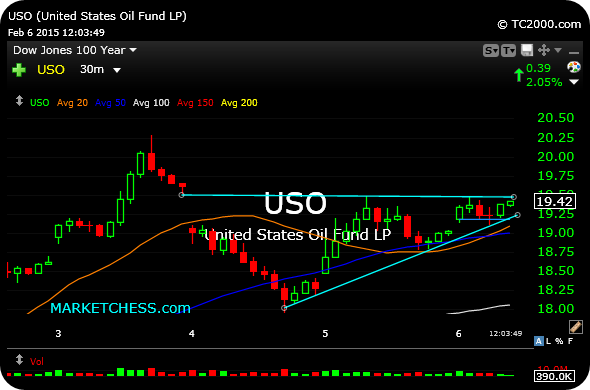
On the 30-minute chart of the USO ETF (straight-up crude ETF), note the gap-fill (top light blue line), as price threatens to move over $19.48. We also have a bullish "ascending triangle" pattern, with the lower light blue line marking a series of higher lows against the flat-top.
What this means, typically, is that buying pressure is building with those higher lows for a breakout (on this timeframe).
UPDATE: I sold 1/3 at $3.87 to scale gains. Same stop.
In what may turn out to be merely a day-trade, I went long UWTI (triple-log crude oil ETF) at $3.69 with a protective stop-loss below $3.55.
My theory is still that crude is a trading vehicle until further notice, in lieu of calling a big bottom or playing for another crash.
As such, quick trades can be found here and there.
On the 30-minute chart of the USO ETF (straight-up crude ETF), note the gap-fill (top light blue line), as price threatens to move over $19.48. We also have a bullish "ascending triangle" pattern, with the lower light blue line marking a series of higher lows against the flat-top.
What this means, typically, is that buying pressure is building with those higher lows for a breakout (on this timeframe).
UPDATE: I sold 1/3 at $3.87 to scale gains. Same stop.