09Feb12:46 pmEST
All the Action in a Small House

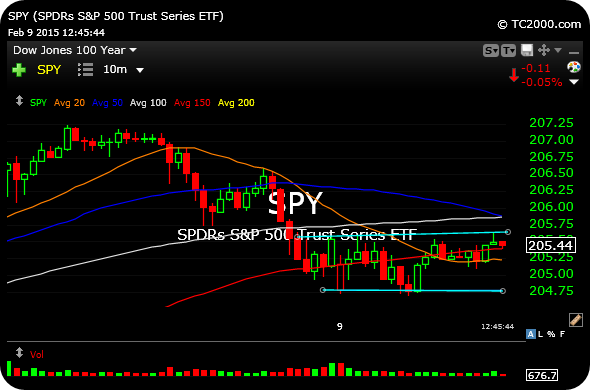
The 10-minute chart of the SPY, actively-traded ETF for the S&P 500 Index, highlights in light blue the sideways action we have seen today off the reversal lower last Friday afternoon.
Short-term traders can use this chart as a roadmap in terms of taking directional scalps for the rest of today's session.
$205.64 is the level to watch above, while $204.70 below is an area bulls likely need to defend.
Overall, the market is fairly slow today, compared to the action we have seen in recent weeks. The house is getting smaller today, but we should still be on watch for a break.