17Feb12:12 pmEST
A Closer Look at Debt

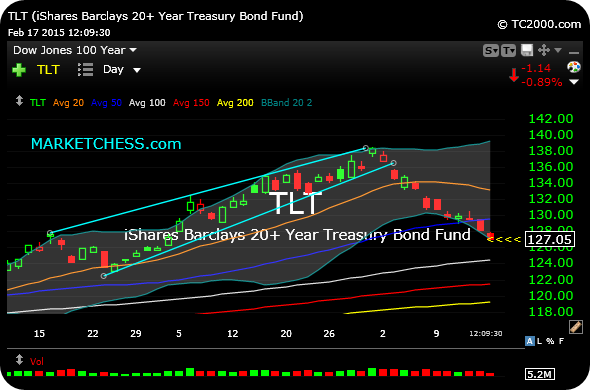
To follow up on the analyst of bonds from last week, you can see that a notable change in character continues to play out. Specifically, gauging the TLT (ETF for Treasuries or bond prices) daily chart, below, dip-buyers failed to defend that 50-day moving average (dark blue line) on the pullback following a rising wedge (light blue line) breakdown.
Bonds have been in an epic bull market since the early-1980s, which means yields have gone lower in that time. In addition, bond bulls have enjoyed a particularly strong rally since early-2014.
However, this type of price action stands in stark contrast, thus far, to the many instances where buyers had arrived to support bonds on any and all pullbacks.
Price is currently bordering on oversold for bonds, using TLT as a proxy, at that lower Bollinger Band. Once again, failure to stage a strong bounce would indicate an increasing change in character.
As such, I continue to stalk rate-sensitive sectors such as REITs and utilities for short entries.