
19Feb1:12 pmEST
Diminishing Returns on Monetary Gadgets

Although still slightly green year-to-date, the bond market is showing some subtle changes in character.
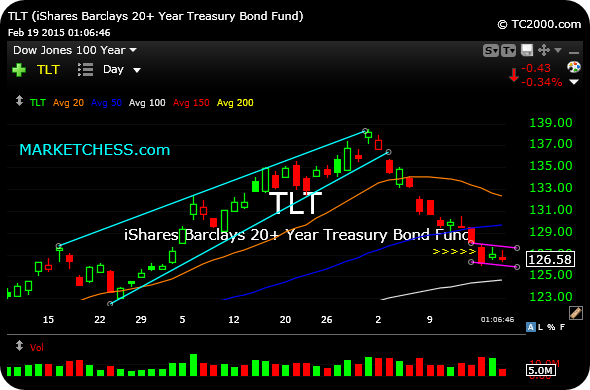
On the TLT daily chart, first below, for Treasuries, note the failure of bulls to immediately buy that pullback to the 50-day moving average after the highlighted (in light blue) rising wedge broke lower. Bond bulls have had a ferocious run of strong dip-buying in recent years--since the early-1980s really--but especially since the beginning of 2014. And now that TLT daily chart could easily be bear-flagging here before another leg lower.
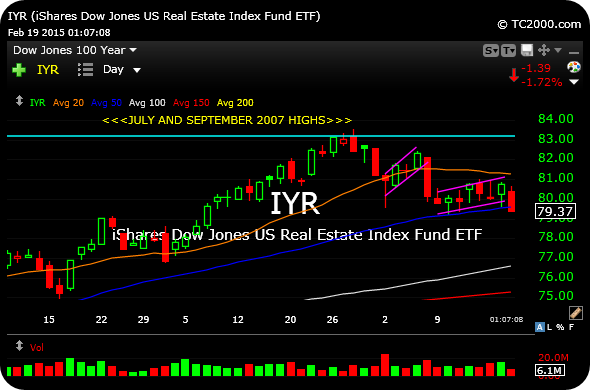
With this in mind, I continue to key off rate-sensitive sectors for shorts, namely the REITs. The second daily chart, below, for the IYR ETF shows yesterday's upside reversal was a head-fake, luring in dip-buyers only to smash them today. As such, I still have DRV and SRS on my radar as bearish ETFs for this sector.
The utilities also look to be bear-flagging on the daily timeframe for the XLU sector ETF daily chart.
Another Episode in Russia; C... Two Delicious Charts This Af...


