
05Mar1:20 pmEST
Two Good Views in the Heart of Winter

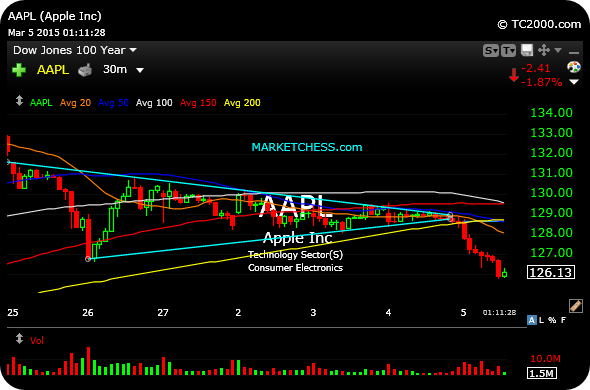
The AAPL 30-minute chart, first below, has been a recurring bit of analysis on this website over the past two weeks. And we can see after the $130.30 the $128.30 levels were lost, price came back down to $126.60 before losing even that level. It will be interesting to see how Apple and the market close with this short-term weakness. Again, know your timeframe--This analysis speaks to short-term trades in Apple and not long-term investors.
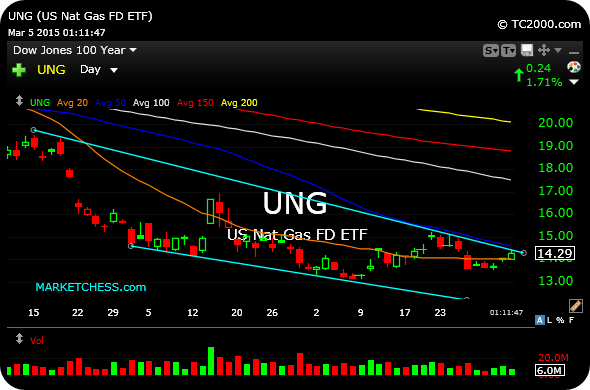
In addition, natural gas is recovering a bit this week. To my eye, on the UNG ETF daily chart, second below, that $14.40 level just above is going to be key to clear, even if it is a mere initial trigger. Note how that coincides with the declining 50-day moving average (darker blue line), as well as the top light blue line market the upper resistance trendline of a well-defined falling channel pattern. As always, patience is a big factor in playing natty, given how volatile the complex can trade.
Pressing for Lethargic Energ... Grinding Away with Indecisio...


