
09Apr12:40 pmEST
Lunchtime Charts

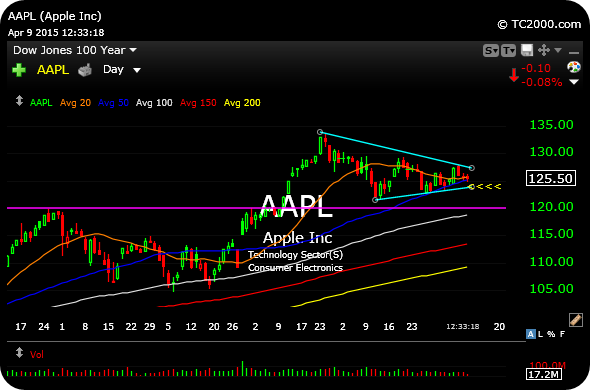
First, my new AAPL short (noted in my last blog post), referring to the first daily chart, below. For my short to have a chance, the stock needs to lose its 50-day moving average with authority. So, consider the short a "tester" to see if the seemingly indomitable Apple can finally take a hit.
If AAPL does lose its 50-day, $120 is the primary breakout area which is next. But my ultimate target would be the $110 area (200-day moving average, too), based on the size of the highlighted consolidation, projecting lower. My stop is above $130. But if I do not like the action for my short I will probably cut it sooner.
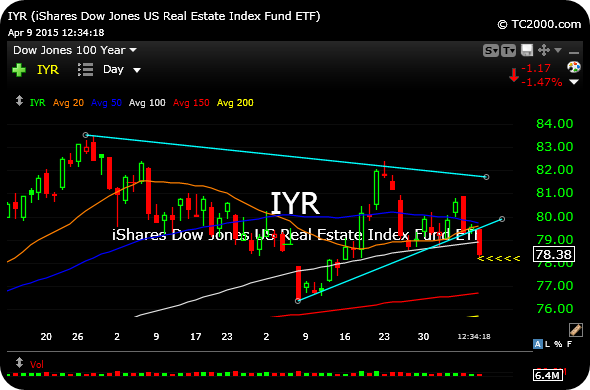
And the second daily chart is of the IYR, ETF for the REITs. We have been looking at this one for a while. Not the breakdown today. If it sticks into the afternoon I still have my eyes on shorting the rate-sensitive complex, including Treasuries.
Standoff at the Open; Chess ... A Dynamite Slice of American...


