14Apr2:55 pmEST
Analyzing the Basic Box

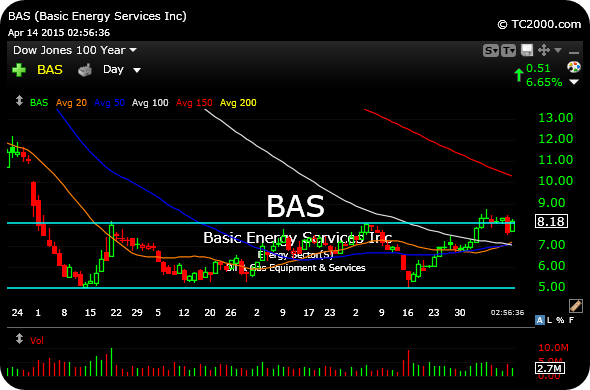
The chart for Basic Energy Services is one we have observed periodically. And it may very well be worth a closer look here not only on its own merits, but perhaps as a means to extrapolate the technical setup to the rest of the energy sector.
On the updated daily chart, below, note that price is threatening to break up and out of the rectangle or box, above $8.10 then $8.18 above the upper light blue line of prior highs.
After the lower light blue line held as true support, the chart implied that the stock could easily be putting in some time of tradable bottom. Indeed, I think you will find many other energy stocks have similar charts, trying to clear multi-month highs. If that happens, it is not a guarantee of a major bottom, but rather some type of snapback rally, at least.
A move back below $7.50 by sellers would likely negate recent progress by bulls.
Earnings are scheduled for April 23rd.

Still Have Bibimbap on My Mi... A Key to Deep Sea Diving in ...


