
09Jun2:50 pmEST
Not So Fast with the Russian Victory
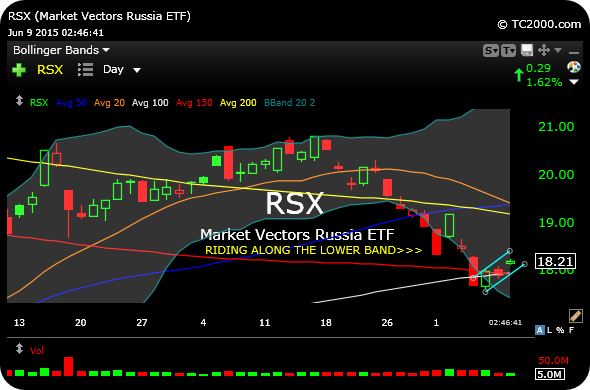
Much like with our analysis of Treasuries (via the TLT ETF) in recent months, when you see a chart ignore oversold conditions and "slide down" the lower Bollinger Band for roughly a week straight, it typically is a sign to become intermediate-term bearish even after the inevitable relief rally.
Indeed, we may be seeing just that with the Russia ETF, RSX, just as we saw with TLT of late, enabling us to pick off successful short trades in the bond market, playing for rising yields.
In the case of Russia, we are currently witnessing some type of effort to alleviate the persistent oversold conditions. Nonetheless, given the above analysis, I have RUSS on my radar as a triple bearish Russia ETF to play RSX downside, if we do see a rollover.
On the RSX daily chart, below, note the Russia ETF may be bear-flagging here, denoted by the light blue lines. A move back down towards $18 anytime soon would have me enticed by the RUSS idea to act.
Good Context for the Afterno... Stock Market Recap 06/09/15 ...


