19Jun12:38 pmEST
A Funny Thing Happened on the Way to an Energy Bottom

After the steep selling in crude oil and energy stocks abated in late-2014, the amount of polarized prognostications became noteworthy. On the one hand, there were many calls by market players and observers called for a major bottom in the entire complex, as many energy plays now appeared deemed "too cheap." On the other hand, sentiment in black gold itself became almost comically bearish in some respects, what with imminent downside targets of $10/barrel.
In reality, if you agreed with my thinking back then, the most likely scenario was a long, slog sideways without much direction--A sloppy trading range, if you will.
Of course, with each rally we heard cries for a major bottom at hand. But those 200-day moving averages on both crude and the energy sector ETFs (OIH XLE, namely) continued to sharply slope lower, continuing to offer the presumption of a bear market still intact.
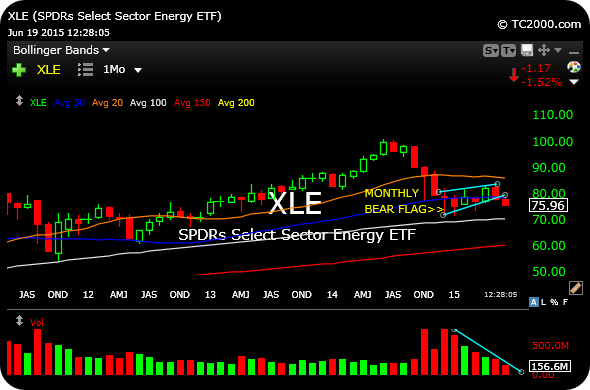
As it stands now, the XLE monthly chart may have formed nothing more than a bear flag continuation pattern (continuing the downtrend, that is) in 2015, heretofore, highlighted below in light blue. Note the absence of a discernible bottoming pattern, let alone a surge in buy volume to pick up the many "bargains."
In addition, sector titans like COP CVX SLB XOM have enjoyed multi-decade bull runs, and may only now be turning downhill--Yet another reason to resist the urge to declare a durable bottom in the complex.
Even if a fresh leg down does not materialize imminently, there is no doubt that the complex continues to lag the market and has failed to sustain a rotation for more than a few days here or there.