
23Jun10:04 amEST
Unclean Energy
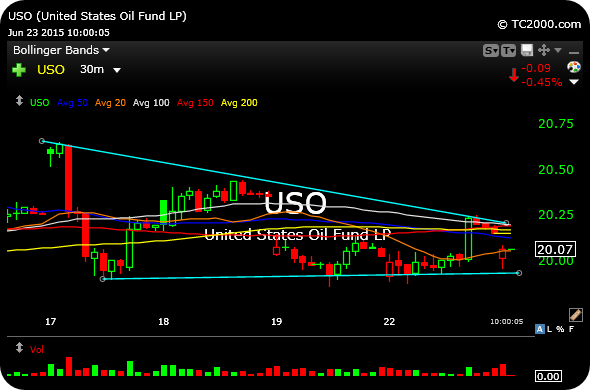
Crude oil is gapping down again. And keying off the 30-minute chart for the USO ETF, below, we can see a descending triangle pattern developing, denoted by the light blue lines. This pattern indicates a series of lower highs against well-defined horizontal support. Typically, it builds up too much pressure against those lows before a breakdown materializes. If we see another plunge below $20 I may look to short black gold, though the inventory report is tomorrow.
Elsewhere, BBRY is experiencing some post-earnings volatility, with recent lows needing to hold for bulls to have any chance at a snapback rally. EYES is finally clearing its long, sideways base consolidation via this gap higher--Let's see if it holds over $16 now. AMBA is snapping back from its shellacking in recent sessions, as you might expect given the success bulls have had in the name. And FB is trying to reassert itself as a bonafide market leader with the strength in recent sessions.
Stock Market Recap 06/22/15 ... Playing the Summer Rotations


