
10Sep2:38 pmEST
Obvious Patterns Falling from the Autumn Trees

it is worth noting that we have yet another fairly obvious setup developing in markets, likely adding to the randomness and whipsaws on a day-to-day basis. Just as the tight market range had become ubiquitous over the summer, with a plethora of articles published discussing the historic nature of the consolidation, we now have a fairly obvious series of triangle patterns forming on the indices since the August 24th "flash swoon."
And just as the market gave us plenty of head-fakes higher before plunging in late-August, breaking its narrow range with authority, we now must deal with the notion that the market rarely makes life so easy for such a widely-watched and obvious pattern.
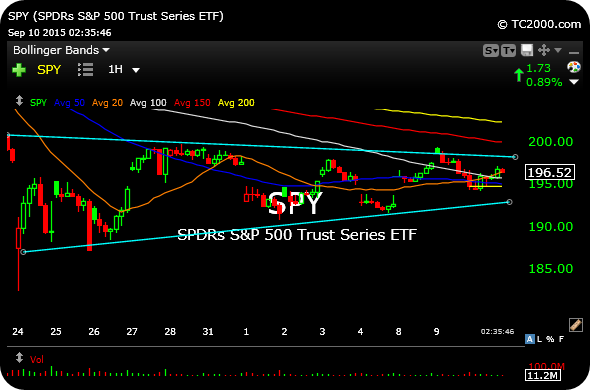
Case in point: The SPY, ETF for the S&P 500 Index, below, on the zoomed-out hourly chart since August 24th, illustrates the lower highs but higher lows, amounting to that obvious triangle or pennant.
Also note that chart patterns can and do morph into larger ones, adding to the complexity of any potential setup.
Indeed, these types of markets challenge your mental toughness more than anything else, as a potentially bearish pennant after steep drop would typically yield another breakdown in an established bear market. But we know we are not there yet, with the multi-year bull run yet to be officially put out to pasture.
Hence, the odds of the pattern morphing or at least sporting multiple head-fakes before resolution likely increases as the cyclical trend is under scrutiny.
n
Mind the Gap Into Football S... Stock Market Recap 09/10/15 ...


