12Oct10:29 amEST
Something is Brewing

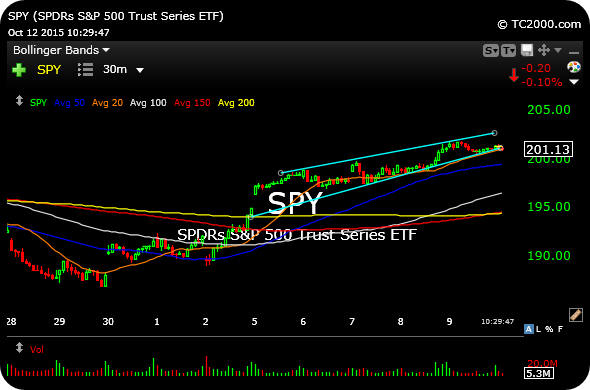
The 30-minute chart for the SPY, the S&P 500 Index's actively-traded ETF, below, offers good prospective on the market's price action since rallying from the late-September lows.
Note the light blue lines I have drawn, which indicate price working through a steep (on this timeframe) rising channel after the initial surge off the lows. So if it feels like a drifting market, that is the primary culprit. If the channel does break lower, say below $201, I suspect we would see the velocity of the price action pick up.
Also note the resurgence of the coffee commodity, JO as the thin ETN, following in the wake of our discussion about sugar last week.
Overall, the mixed signals from LLY weakness in healthcare and AMGN ESPR REGN strength in biotech seem to be canceling each other out on this Columbus Day morning.