
16Dec10:45 amEST
Foul Line Extended

One of the more overlooked aspects of technical analysis is that prior trendlines, valid because the market has shown sensitivity to them, are still value-additive to your process as a trader even after they have seemingly been breached and a prior pattern has been completed.
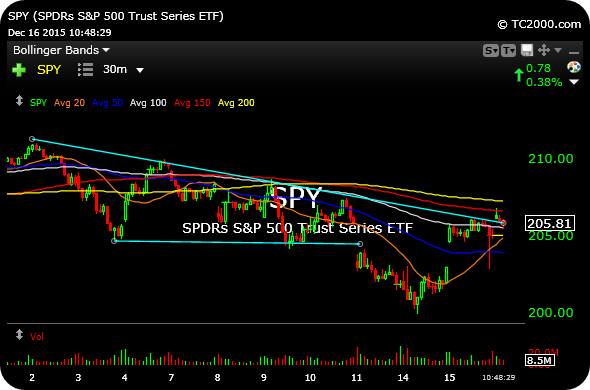
Case in point: In recent weeks both on this website and for Members in real-time we had been tracking a well-defined 30-minute timeframe "triangle" pattern on SPY, which is the actively-traded ETF of the S&P 500 Index.
The upper resistance light blue trendline acted as a brick wall, pushing SPY into making a series of lower highs as sellers presented themselves at each test. And then SPY broke down below the pattern last Friday, and coming close to hitting a measured move target lower off the pattern.
At that point, many traders would take the pattern off their charts, considering it yesterday's news.
However, on the updated SPY 30-minute chart, below, note how extending out that resistance trendline came back into play this morning, as the opening move higher in the market ran, again, into sellers as it had previously.
As we move throughout the session and lead into the FOMC activities later in the day, this SPY chart continues to offer a good frame of reference and a lens through which to view the market action.
Stock Market Recap 12/15/15 ... It's the Money Shot Time of ...


