30Dec12:56 pmEST
The Great Wall of Tesla

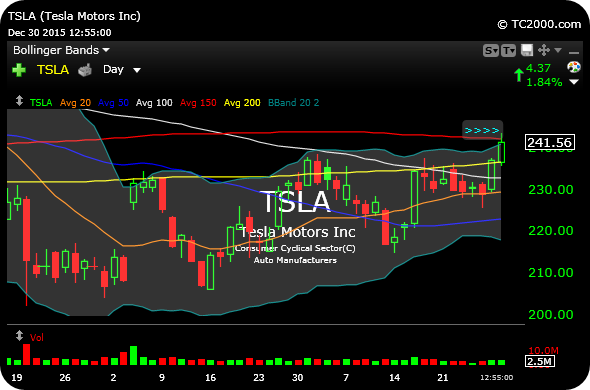
Tesla finally conquered its 200-day moving average today, which has been akin to a great brick wall for quite some time for the stock. However, the stock has still been largely rangebound since early-2014, much to the chagrin of momentum traders who enjoyed a fairy smooth ride higher in 2013.
On the updated daily chart, below, if TSLA is going to regain its leadership status and follow the likes of the FANG gang, then holding over that yellow line (200-day on my chart) is likely necessary, headed into 2016.
Also note the stock is now short-term overbought as price punches up through its upper Bollinger Band, and is also finding some intraday selling at its 150-day moving average.
Despite the fanfare, which we have seen accompanying each Tesla bounce for years now, the chart still has its work cut out for it if it is going to improve in 2016.

Still Some Trouble from Abov... Stock Market Recap 12/30/15 ...


