
24Mar11:05 amEST
The Tesla Hudsucker Proxy

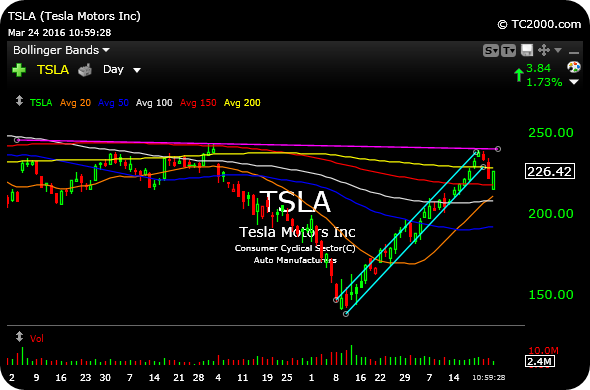
In what has been a fairly easy market to get chopped up, the chart for Tesla Motors remains a good way to make sense of the action over the past few weeks and months. TSLA is a momentum leader which suffered a sharp correction in January, then proceeded to rally more than 50% into March before pulling in the last few sessions.
Clearly, TSLA was ripe for some type of giveback off prior resistance (purple line on daily chart, below, denoting overhead supply), in addition to still sporting a declining 200-day moving average (yellow line).
But just because we know there is likely overhead supply does not mean that TSAL must necessarily roll back over to fresh lows--All the overhead supply gives you is a likely, initially, expected pause or pullback in a high probability manner.
After that short-term mechanical move, the real test sets in.
This morning, for example, TSLA flipped to green in the face of a broad market gap down. And so we know should get a better, more objective answer as to whether TSLA and perhaps the broad market are merely gearing up for a new leg higher into the end of quarter next week, or instead will keep moving lower.
Should the TSLA bounce today slip on the banana peel and close red, it would be a good indication of the latter. Either way, in light of TSLA's recent run and chart dynamics, I view the outcome as a good proxy for stocks in general, headed into April.
Stock Market Recap 03/23/16 ... Fighting the Good Fight Into...


