
06Apr3:38 pmEST
Painting the Picture

Although now overbought in the short-term, the biotech sector ETFs (IBB, XBI) may have a bit more juice in the tank before we would expect overhead supply to materialize.
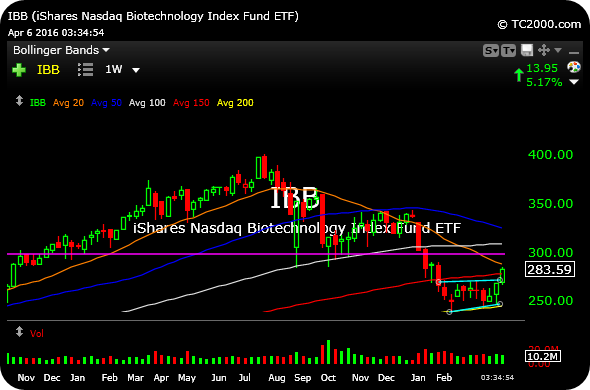
To give you the bigger picture, the weekly IBB chart, below, illustrates that the larger cap biotech may have a date with $300, above, before a higher probability short setup awaits.
So, while the likes of AMGN BIIB CELG GILD REGN are all punching up into their upper Bollinger Bands on their daily charts (rendering them short-term overbought), this picture has me holding off on the likes of BIS or LABD for now.
Counter Moves in a Complex G... Stock Market Recap 04/06/16 ...


