
13May10:42 amEST
Know What You're Hunting For

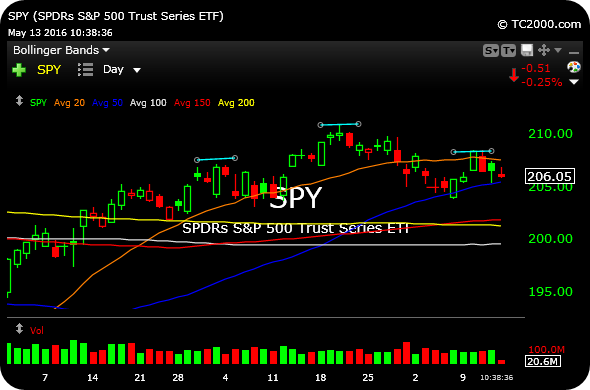
The back-and-forth nature of the action over the past week or so can be reflected in two charts, differing timeframes of the SPY (ETF for the S&P 500 Index).
First, the daily chart shows a possible head and shoulders top (the right shoulder can be higher than the left shoulder in a valid top), below in light blue on the first chart.
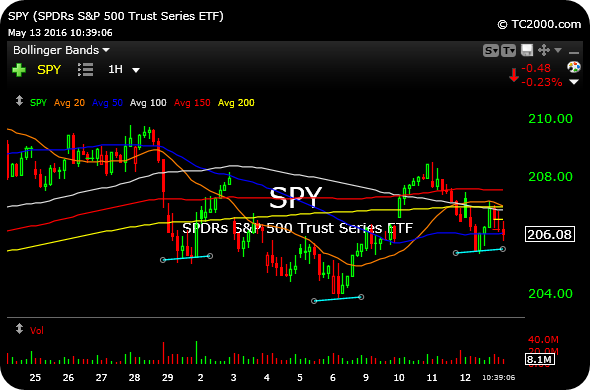
Next, the hourly chart shows a potential inverse head and shoulders bottom, also in light blue.
In reality, neither pattern has been confirmed, and this we have drifting rangebound action. We are looking to see whether the continued retail carnage, today in JWN, is a sign of something beyond AMZN simply winning big-time at the expense of old hat retail names.
In a stronger broad market, I suspect I would be more aggressive in pushing long setups like BSX and ISRG. But given the drift, I am more focused on not overextending myself as the market sorts out where it wants to head into summer.
Stock Market Recap 05/12/16 ... A Backdrop of New Mexico Arc...


