
19May10:47 amEST
A Controversial Strategy

Charting the VIX and its derivative products is kind of like being a vegan these days--Some proudly do it and see the justification for it...and some proudly mock those who do it.
The competing arguments for charting the VIX and its ETF products are such that, on the one hand, the VIX is several times removed from equities, for example (the VIX loosely measures fear in the options market, which is derived from the equity market by definition, and the VIX ETFs are derived from the VIX), and therefore it is simply too convoluted to even try to analyze the technicals.
On the other hand, charting purists argue that if anything trades via price, then it can be charted, and thus it can be analyzed--Simple as that.
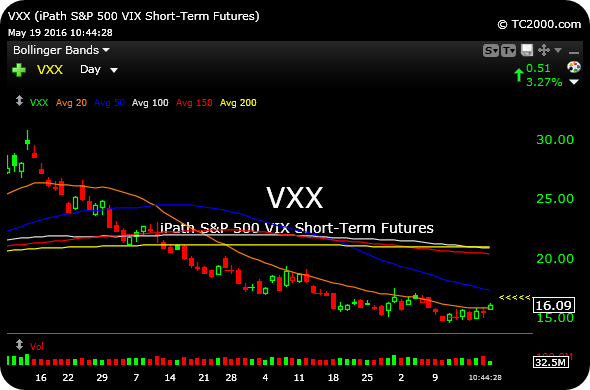
My take: Basic analysis can be used on the VIX and its products, with the forest for the trees perspective being the most important component rather than getting immersed in picayune details of the chart, several times removed from equites in the case of the VXX ETF daily chart, below.
Regarding VXX, the simple analysis is that the 20-day moving average (orange line) has been guiding price lower for a good while since the winter months as equities remained resilient albeit choppy.
Using this basic test, the VXX holding over the 20-day would now mark at least some type of character worthy of your attention, since that has obviously been an issue for VIX bulls since early-February.
Stock Market Recap 05/18/16 ... More Celebration for Shortie...


