
10Jun10:47 amEST
Underwater Scenery

Despite the rally in many biotechnology stocks since February, the lingering issue for the formerly leading sector remains the long-term chart.
Specifically, the XBI (small/mid-cap biotech ETF) houses many of those high growth biotech issues, which could also be ripe to be bought out. Many of them are heavily-shorted and capable of explosive squeezes, perhaps equally as well as a surprise FDA ruling which crushes them. Alas, such is life in the biotech sector.
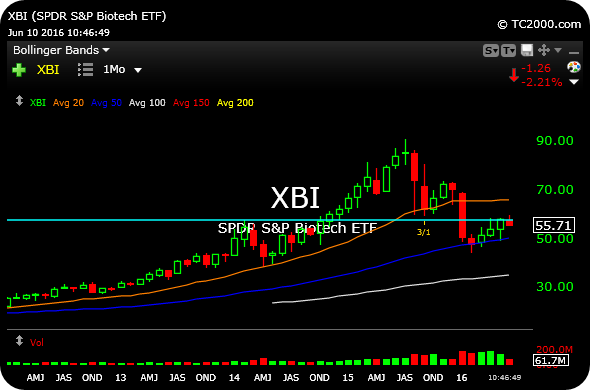
But for the larger purpose of broad market analysis of a major sector, note the XBI monthly chart, updated below.
Moves back above $57.50, the highs from early-2014, have been faded of late. And the chart still illustrates lower highs and lower lows by price dating back to the peak made last July in the face of what had been speculative fervor.
On days like today it is, of course, very easy to cherry-pick this chart and declare it to be prima facie evidence of the bear case out in full force. However, we profile this chart daily for Members, not to pick a bias but rather to note that the biotech sector still has much, much more improvement to make in order to follow any bull run in the indices to fresh highs.
As such, trading individual biotechs remains much more of a quick dating premise than a long-term relationship one. Simply put, bulls are likely going to need more ammunition than the prospect of more M&A and a few squeezes--A more broad-based rally to improve the sector is desired.
Moreover, if bears do prevail this summer, then the high beta biotechs become much more viable as aggressive short targets, particularly if XBI now fails at the $55 into next week, the scene of its 50-day simple moving average.
Stock Market Recap 06/09/16 ... The Greenback is Still Hangi...


