31Aug1:19 pmEST
The Mosaic Versus Under Armour Dynamic is a Microcosm of the Market

As the market puts the finishing touches on a choppy August, it is worth revisiting the Mosaic chart we observed yesterday when fertilizer plays were running off the AGU POT merger talks.
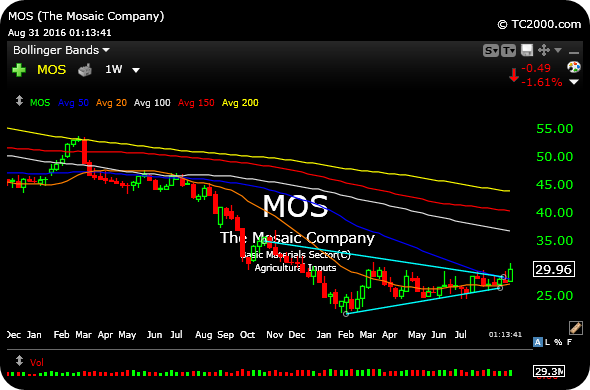
MOS is threatening upside resolution from a symmetrical triangle consolidation (first weekly chart, below) after a steep, multi-year downtrend.
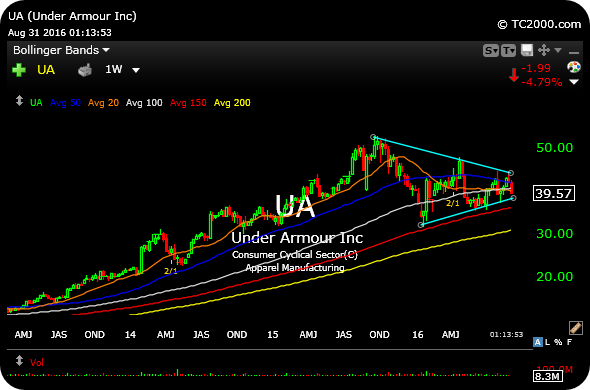
Inversely, the consumer/retail play Under Armour, second weekly chart, is working through a symmetrical triangle after a strong, multi-year uptrend.
Typically, we expect the symmetrical triangle to resolve in favor of the prevailing trend. Here, that would mean MOS breaks lower yet, and UA continues its uptrend.
However, it is certainly worth noting when markets deviate from that expected path. As you can see, MOS is threatening an upside break, while UA has been glaringly weak in recent sessions (along with NKE, which we shorted inside Market Chess Subscription Services).
One cannot help but conjure up memories of the early part of 2008, when the long Apple/short Potash trade was flipped on its head as ags surged for a good while and marquee brand names unwound.
In this case, the issue is whether select commodities (miners, materials) can continue their progress into autumn and perhaps benefit from capital rotating away from some of the dominant consumer names like DIS NKE SBUX UA.


Just When You Thought Bird w... Stock Market Recap 08/31/16 ...


