07Oct11:01 amEST
Betting the Over/Under, Then the Under/Over

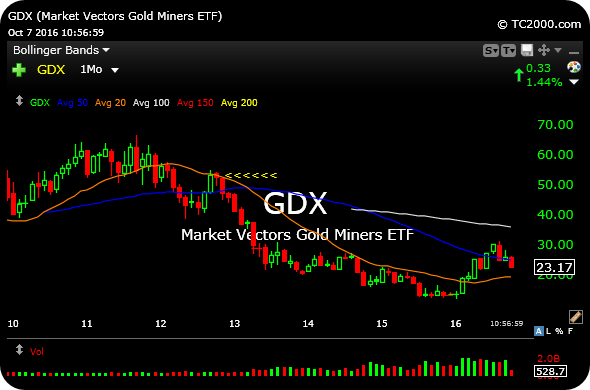
Taking a longer-term view of the GDX, ETF for senior gold miners, tells the story of how the gold bear market came to fruition from a technical perspective.
On the GDX monthly timeframe, note the 50-period monthly moving average, the dark blue line. This is obviously a very long-term reference point and is not going to change its slope in a hurry, so it gives us good perspective on the dominant trend.
Currently, the 50-period monthly is still sloping lower, as gold bugs have some more work to do on this timeframe that a new bull run is underway.
But at inflection points we often see a disconnect.
Case in point: Back in the autumn of 2012 (yellow arrows), just before out last General Election coincidentally, gold miners rallied sharply with a rising 50-period monthly. However, that rally failed for an "over/under" move, meaning above then below the dark blue line. That move also cemented a major lower swing high for the miners, another bearish development. The bear market then became full-blown and never looked back (higher).
So the issue here is whether we are on the cusp of an "under/over" move, the reverse of the prior action where we now dip below the 50-period monthly and then reverse higher and never look back (down).
Miners are green this morning after the jobs number. But the rally is not particularly forceful at the moment. Back in 2012, the "real" started to materialize after the election. So, it would not surprise me if we have some more time here, as well, for a potential rally to emerge with a bit more muscle. I still, for example, would prefer seeing the juniors in the GDXJ tag their own 200-day moving average on the daily first.