31Oct3:40 pmEST
Add This Wedge to Your Spreads

On the back of the crude oil weakness today, note that high yield corporate and junk bonds have recently been showing some cracks in the foundation.
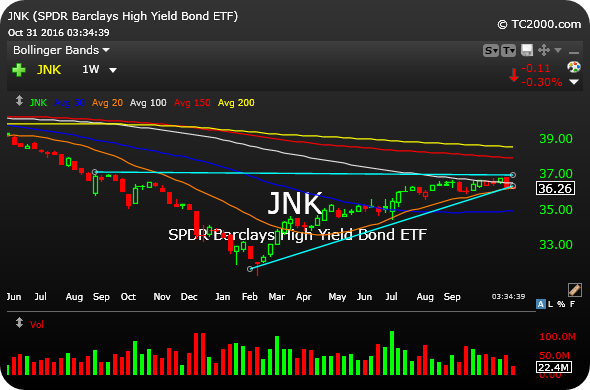
If you doubt there is at least some correlation between HYG JNK and equities, note the JNK ETF weekly chart, below, which shows us that junk and stocks both bottomed in February of this year right at the same time, and have both largely enjoyed either higher or sideways action since.
But the risk to credit spreads is they may start to blow out a bit, which would mean the highlighted rising wedge pattern resolves down. Plenty of energy firms have exposure to the HYG JNK ETFs, which is another layer of analysis on top, too.
The take-home message here is that in order for the pullback in equities to largely stay contained and possible set-up a year-end holiday rally, credit should stay afloat. Should HYG JNK decisively breakdown here I suspect the bear case for stocks at-large strengthens immensely.