24Feb9:27 amEST
A Simple Test of Violence

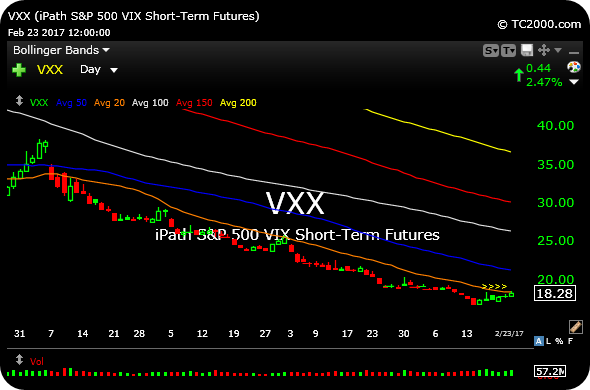
As quaint as it may seen, the VIX ETF, VXX, has ben unable to hold over its 20-day simple moving average since Election Day.
To be sure, I am not one to put too much stock in technical analysis of the VXX, since it is, after all, several times removed from equities. Still, the setup is simple, easy to track, and should give insight as to whether we are on the cusp of the violent selling in stocks, with this opening gap down, that bears have been craving for quite some time.
On the VXX daily chart, updated below, note the orange line, the 20-day, guiding it down since November. Any changes in character should now be apparent, especially with the swoons in ACIA NVDA high beta names giving bears little in the way of excuses now for a market pullback. Indeed, failure here by bears would be devastating in terms of the potential for a surprise squeeze.
Either way, this chart, as simple as it is, should give you a good frame of reference.

Stock Market Recap 02/23/17 ... Foot Locker: Turn That Retai...


