28Jul10:08 amEST
A Venti Breakout? Not So Fast, My Friend
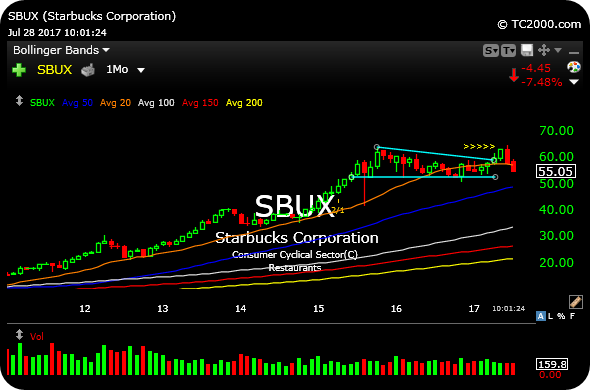
The monthly chart of Starbucks, a major consumer name, illustrates a point worth noting about some f the more prominent, multi-year winners in this market--Their long-term charts are a bit concerning insofar as covering much ground since 2009, then possibly forming a new consolidation before apparently breaking out earlier this year.
But what if that breakout turns out to be a fake-out?
Regarding SBUX, the chart below shows that the breakout was at least initially faded. As I noted in the blog post prior to this one in a video, we do not want to become overly-dramatic about initial faded breakouts. We merely acknowledge the chart may need more time.
However, if SBUX follows-through lower into Labor Day and beyond, I would grow more concerned about the long-term viability of the recent breakout attempt. Below $50, for example, and bears will likely growl about an undisputed bull trap earlier this year in terms of the upside move merely serving to lure in longs to be trapped.
While the FANG stocks like AMZN are still far from this false breakout territory that SBUX is flirting with, we still want to keep an eye on how deep this tech selloff goes and where and when bulls make a stand.
Inside Market Chess Subscription Services, we spent the last four sessions lightening up on longs and looking to see whether the current bounce in precious miners has legs, since the miners have a tendency to act inversely to equites during corrective periods.