14Aug10:34 amEST
Rough Topography

A Monday morning opening gap higher may very well excite buyers from late-last week, but as far as some of the major index charts are concerned the action is becoming rather sloppy.
In prior instances during this bull run, however, we know that sloppy charts do not necessarily equate to a market top on the indices. Thus, the burden of proof remains with the bears to undo any V-shaped rally attempts by bulls back to new highs.
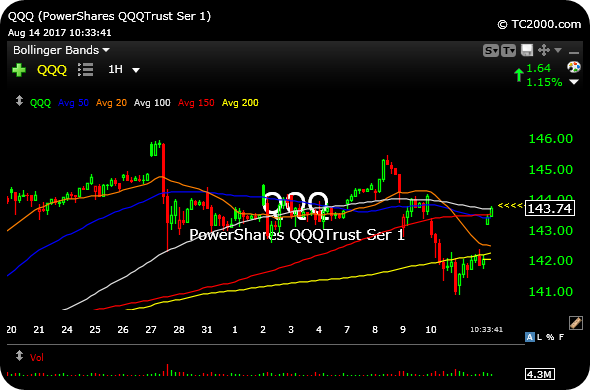
On the QQQ ETF hourly chart, below, the Nasdaq's top 100 stocks are back up to the $144 area. Note that beginning in late-July the chart started to flash signs of wanting to consolidate or correct.
And now that we are back up to a level this morning which became stiff resistance last week before a downdraft, it should serve as an excellent litmus test for both sides as to what type of market, exactly, we are dealing with at this moment in time.
My plan here is to continue to update a focused and cogent like of relative standout names for Members, all the while not yet assuming that the market has completed it consolidation or correction, until we see a bit more concrete evidence it has.
Either way, the topography of many index charts is becoming rougher by the day which makes swing trading aggressively less desirable for now.


