25Oct3:44 pmEST
Keep an Eye on This

Like most macro theses, the case for higher rates has taken its sweet old time to develop. And, frankly, if we are headed in that direction then we are beholden to the market, who will take us there when she is good and ready.
It is also worth noting that there are a few ways to interpret higher rates, be it justified with strong economic growth and jobs or, instead, in a bearish light when viewed through the prism of bond market vigilantes wrestling the initiative away from a soon-to-be-powerless Federal Reserve.
Again, this is all getting way ahead of ourselves.
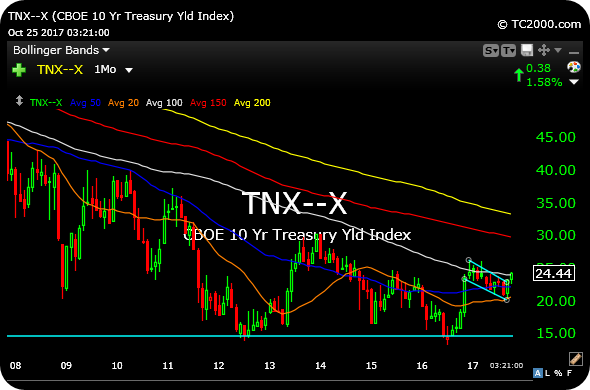
But it is worth keeping the monthly chart for the 10-year Treasury Yield Index, below. This chart essentially reflects rates on the 10-year, inverse to bond prices. Thus, a spike in rates (it is the rate at which rates rise which can cause dislocations across markets in general) would be something to behold. As you can see, rates appear to be coiled up for a move after essentially basing since 2011 with a series of lows below 2% in 2012 and 2016.
Some market players and pundits, such as Bill Fleckenstein, argue a spike over 3% may be enough to cause problems, while others like David Tepper are thinking 4% is a better gauge.
Either way, the coiled nature of the chart at this moment in time after operating in a range since 2011 has me thinking a new directional move for rates may materialize sooner than later, with 2018 perhaps serving as significant year for rates.