
25Jul10:35 amEST
Revisiting the Full, Traditional BREXIT

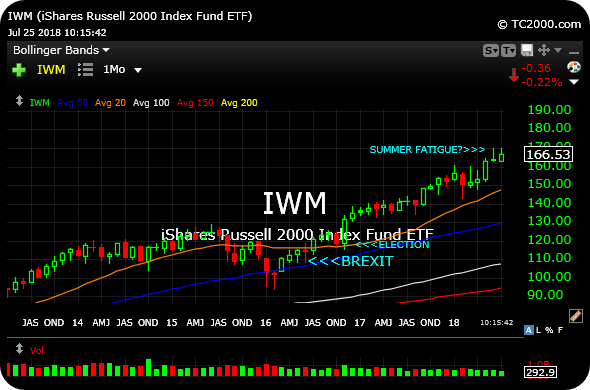
As the small caps in the Russell 2000 Index flip back to red as I write this, the monthly chart for the IWM ETF provided some interesting long-term perspective.
Without questions, small caps have been on a tear since 2016, namely since the BREXIT shakeout.
We can see as much on the monthly IWM, below, which I have annotated for you. You will see how the only blemish, if at all, on the small cap rally was the volatility we saw back in February of this year.
Apart from that, small caps have been undeniably strong and a microcosm of a surreal bull market, shrugging off any and all bad news and seemingly bull-crushing developments on the geopolitical, fiscal, and monetary fronts.
Thus, when we see the type of heavy selling at a potential breakout point to new highs like we did yesterday it ought not be too surprising--Simply put, small caps are due for a breather and seasonality this time of year is often rough. The June and July (still forming, of course) monthly candlesticks seem indicative of buyers perhaps running out of juice in the short-term, unable so far to hold above $170.
Calling major tops to major index charts continues to be a uniquely difficult task, likely far more difficult than calling a bottom to a bear market (which is uniquely arduous, too). But we still must pay attention to the market signals when momentum is waning and could use a long overdue reset, which arguably dates back to BREXIT.
Stock Market Recap 07/24/18 ... Is it Safe: Update on Netfli...


