
27Jul10:59 amEST
His First Appearance in a Good While

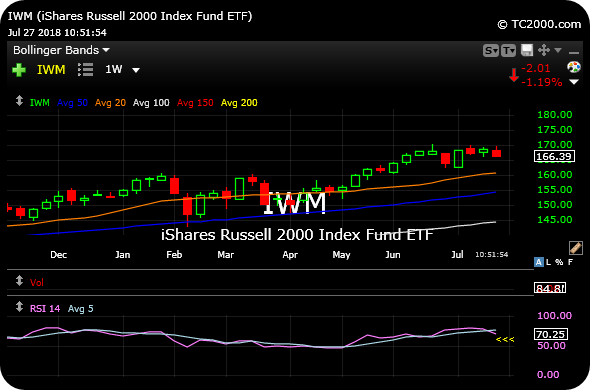
The RSI (Relative Strength Index), seen on the bottom pane of the IWM (ETF for the Russell 2000 small cap Index) weekly chart, below, is often seen as irrelevant during a bullish trend, since there are too many false signals and negative divergences which not only fail to resolve price lower, but actually seem to trap in shorts before the next launch higher.
Thus, we have not discussed the RSI much on this site for a good while now.
However, when the market is mixed and flashing conflicting signals, it is more noteworthy to see the IWM flashing its first bearish RSI crossover in quite a while. The last time we saw a bearish RSI crossover off the highs, indicative of waning underlying strength, was back in March. That crossover led to multi-week softness in the small caps.
Similarly, with the IWM selling off today in the face of a strong GDP print and AMZN nearly doubling earnings estimates per share, I suspect the bearish IWM RSI crossover is at least worth noting and tracking as we head into August.
Moreover, given the constant rotation we have seen it will be interesting to see if other indices can ignore this IWM weakness, though I suspect based on today's action that market players are cognizant of seeing the small caps slide down more than 1% as I write this.
Stock Market Recap 07/26/18 ... Intraday Ideas and Analysis ...


