
13Nov10:43 amEST
Not Just a Matter of Semantics, You Know
With crude oil still flashing deep red as I write this, while Apple and Goldman Sachs are putting in rather tepid bounces so far, it is worth reiterating that when we speak of chart patterns we must frequently use the word "potential" when appropriate.
Specifically, if a chart pattern is only theoretical and has not yet been confirmed, we simply must speak in terms of, for example, the major averages currently forming "potential" inverse head and shoulders bullish patterns.
At this point, those pattens have actually garnered quite a bit of attention from traders across social media and even on the financial news networks, which is indeed rather concerning considering that the market rarely makes bottoming patterns quite so obvious and, more importantly perhaps, quite so accepted by most traders.
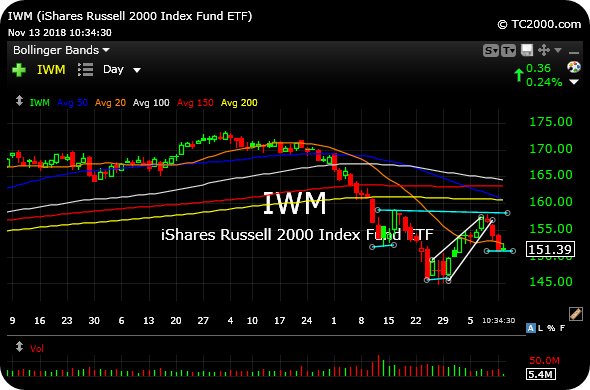
Thus, the small caps' potential inverse head and shoulders bottom (alongside the S&P 500), updated below on the IWM daily chart, still could just as easily amount to a bear flag breakdown (white lines).
Until we get and hold above that $158 neckline, it is tough to make too many assumptions for the bull case, even with the holidays approaching and even withe President Trump suggesting renewed trade talks--The market is the final arbiter and during corrections we often need to be reminded of such far more frequently.
Moreover, as USO is sliding lower and lower, ignoring oversold conditions and the many bottom-fishers out there, we simply must respect the message of the market that something may be amiss, at least until crude can hold a modest bounce.
Stock Market Recap 11/12/18 ... Stock Market Recap 11/13/18 ...


