
14Nov2:31 pmEST
Remember Me: Benny Blanco from the Backtest?

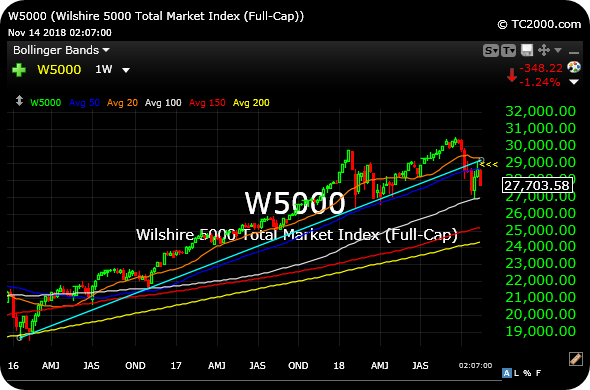
Several weeks ago we observe the weekly chart for the Wilshire 5000 Total Market Index, which is the most comprehensive of the indices in that it measures performance of all U.S. equity securities with readily available price data. When we looked at that Wilshire chart previously, we observed the major support trend-line since early-2016 which has been broken. If nothing else, we surmised that was a sign to slow down on the long side and adopt a more defensive posture.
Since then, the bulls attempted to reclaim the major support trend but look to have been rejected at the 29,000 level (arrows, below on the updated weekly timeframe).
The reason why this major trend-line is so important is that it dates back nearly three years to when the latest phase of this bull began. Recall that late-2014 through early-2016 consisted of corrective action, with some declaring it a shallow bear market even.
Either way, this type of chart adds better perspective to our trading arsenal than obsessing over non-yet-confirmed daily chart potential bottoming patterns.
Much like Benny Blanco from the Bronx, this failed backtest looks to have come home to roost for bulls.
Stock Market Recap 08/10/15 ... All is Not Fine on the Rhine


