
17Dec2:06 pmEST
The Biggest Napoleon Complex

With all of the talk about rates, trade wars, the economy, leveraged loans, debt, and geopolitical risks, it is easy to lose track of the fact that of all the index charts we track for Members related to U.S. equities, it is actually the micro-cap issues which have been leading us lower.
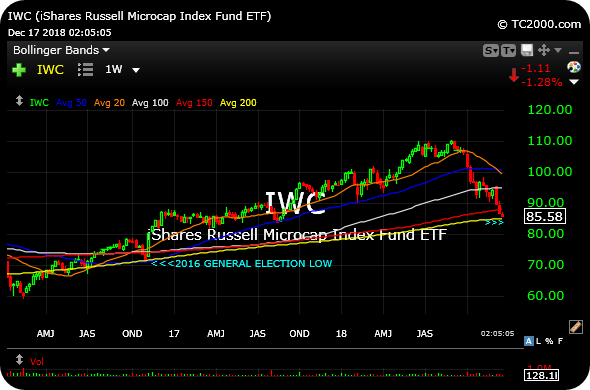
The IWC, ETF for the iShares Russell Micro-cap Index, transcends even the small caps housed in the IWM in terms of how much of a Napoleon Complex they have been harboring during this correction.
Case in point: Of the Wilshire 5000, NYSE, IWM, QQQ, SPY, DIA, and MDY (mid-caps), the IWC currently is closest to tagging its 200-period weekly moving average (yellow line on weekly chart, below).
You will note that the last time the IWC sank to its 200-period weekly was on the eve of the November 2016 Election of Donald Trump, which subsequently saw a violent overnight shakeout in the futures market before a fresh bull run commenced.
Bulls may be a bit too sanguine in assuming a similar scenario materializing this time around on the 200-period weekly test. However, there is no denying that a major test is about to be underway with tons of pressure building for the FOMC this week to feature a much more open-minded if not dovish Fed.
A Defined Holiday Scene in P... Stock Market Recap 12/17/18 ...


